Indications Suggest ARTHUR J GALLAGHER & CO (NYSE:AJG) Could Be on the Verge of a Breakout.
By Mill Chart
Last update: Apr 22, 2025
ARTHUR J GALLAGHER & CO (NYSE:AJG) has been identified as a Technical Breakout Setup Pattern by our stock screener. This pattern typically occurs when a stock takes a pause after a significant rise, indicating the possibility of a continuation in the trend. While it's impossible to predict with certainty, it might be beneficial to monitor NYSE:AJG.
Analyzing the Technical Aspects
As part of its analysis, ChartMill provides a comprehensive Technical Rating for each stock. This rating, ranging from 0 to 10, is updated on a daily basis and is based on the evaluation of various technical indicators and properties.
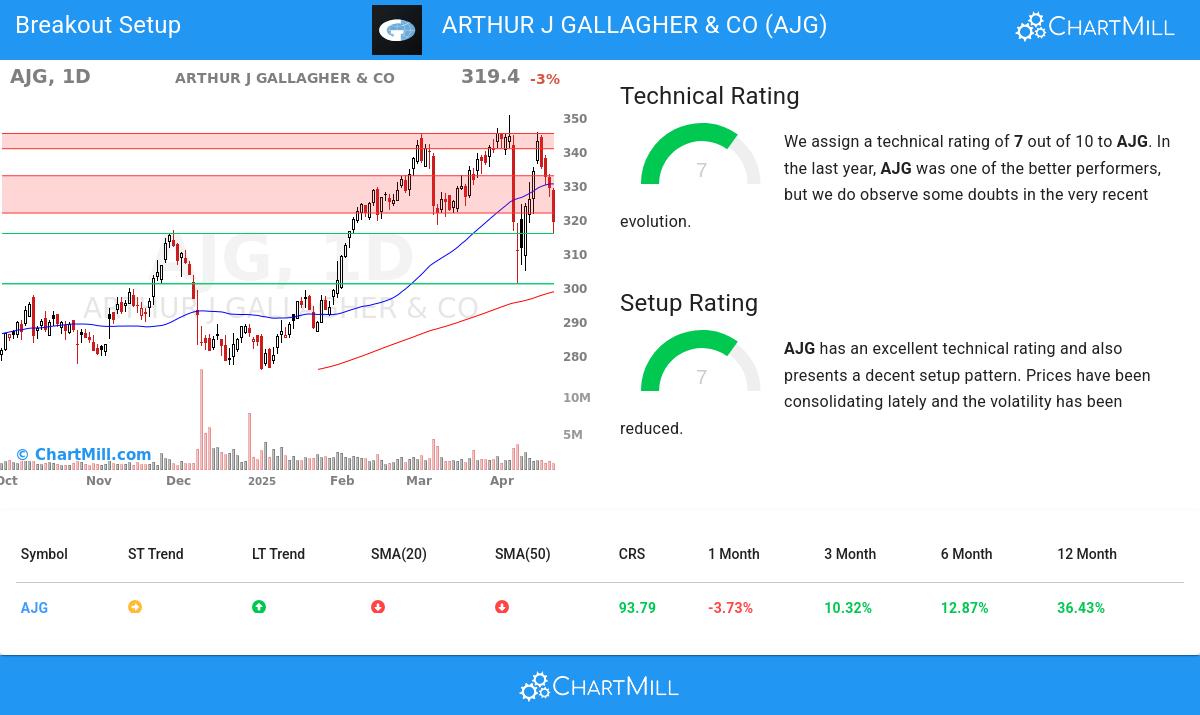
Taking everything into account, AJG scores 7 out of 10 in our technical rating. This is due to a consistent overall performance, although we see some doubts in the very recent evolution. In the medium time frame things are still looking good.
- The short term is neutral, but the long term trend is still positive. Not much to worry about for now.
- Looking at the yearly performance, AJG did better than 93% of all other stocks. We also observe that the gains produced by AJG over the past year are nicely spread over this period.
- AJG is one of the better performing stocks in the Insurance industry, it outperforms 89% of 143 stocks in the same industry.
- AJG is currently trading in the upper part of its 52 week range. This is a good signal, certainly because the S&P500 Index is currently trading in the lower part of its 52 week range.
- In the last month AJG has a been trading in the 301.21 - 350.69 range, which is quite wide. It is currently trading in the middle of this range, so some resistance may be found above.
For an up to date full technical analysis you can check the technical report of AJG
How do we evaluate the setup for AJG?
Next to the Technical Rating, the Setup Rating of a stock determines to which extend the stock is consolidating. This score also ranges from 0 to 10 and is updated daily. The setup score evaluates various short term technical indicators. For AJG this score is currently 7:
Besides having an excellent technical rating, AJG also presents a decent setup pattern. Prices have been consolidating lately and the volatility has been reduced.
How can AJG be traded?
For a potential trade one would typically wait until the stock breaks out of the consolidation zone to enter the stock and it could be sold again for a loss when it would fall back below the zone.
Disclaimer: This article is not intended to provide trading advice. It is crucial to conduct your own analysis and consider your own observations and trading style when making investment decisions. The article solely presents technical observations and should not be relied upon as a sole basis for trading.
Our Breakout screener lists more breakout setups and is updated daily.
Keep in mind
This article should in no way be interpreted as advice. The article is based on the observed metrics at the time of writing, but you should always make your own analysis and trade or invest at your own responsibility.
319.4
-9.82 (-2.98%)
Find more stocks in the Stock Screener
AJG Latest News and Analysis
 2 minutes ago - ChartmillIndications Suggest ARTHUR J GALLAGHER & CO (NYSE:AJG) Could Be on the Verge of a Breakout.
Investors are keeping a close eye on ARTHUR J GALLAGHER & CO (NYSE:AJG) as it boasts an impressive technical rating of 7 out of 10, signaling a possible breakout.
