While growth is established for NYSE:AGI, the stock's valuation remains reasonable.
By Mill Chart
Last update: Feb 13, 2025
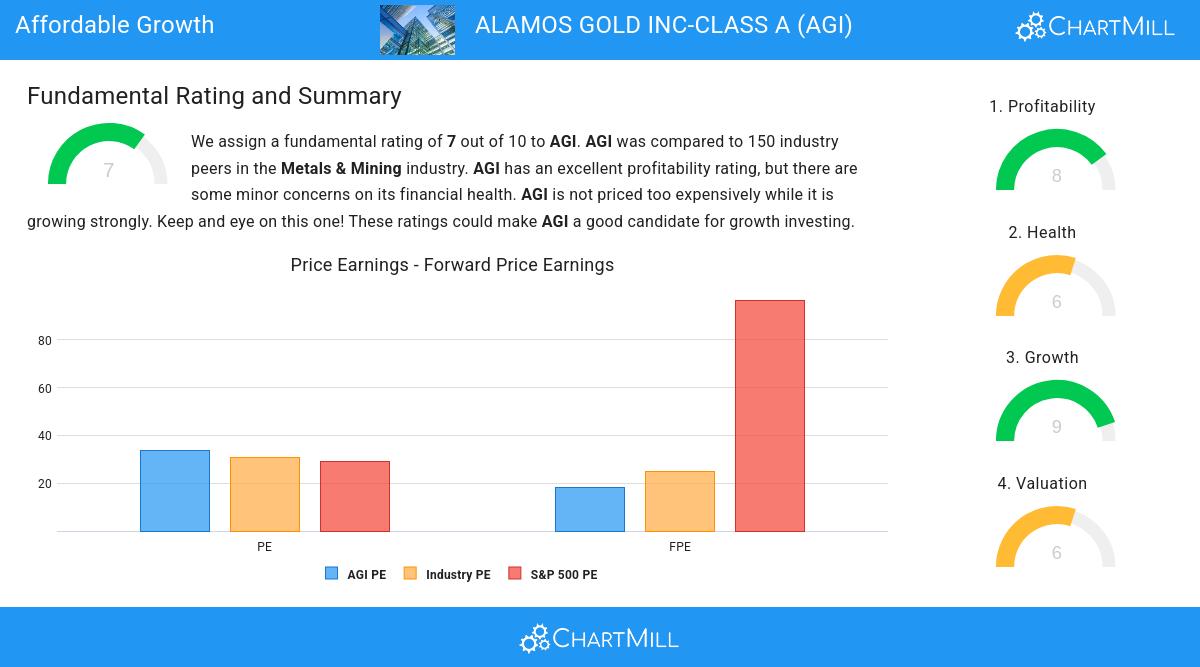
Take a closer look at ALAMOS GOLD INC-CLASS A (NYSE:AGI), an affordable growth stock uncovered by our stock screener. NYSE:AGI boasts strong growth prospects and excels in financial health indicators, all while maintaining a reasonable valuation. Let's break it down further.
Looking at the Growth
ChartMill employs its own Growth Rating system for all stocks. This score, ranging from 0 to 10, is derived by evaluating different growth factors, such as EPS and revenue growth, taking into account both past performance and future projections. NYSE:AGI has earned a 9 for growth:
- AGI shows a strong growth in Earnings Per Share. In the last year, the EPS has been growing by 36.00%, which is quite impressive.
- AGI shows a strong growth in Earnings Per Share. Measured over the last years, the EPS has been growing by 60.35% yearly.
- AGI shows a strong growth in Revenue. In the last year, the Revenue has grown by 22.50%.
- AGI shows quite a strong growth in Revenue. Measured over the last years, the Revenue has been growing by 9.44% yearly.
- AGI is expected to show a strong growth in Earnings Per Share. In the coming years, the EPS will grow by 33.20% yearly.
- The Revenue is expected to grow by 20.15% on average over the next years. This is a very strong growth
- When comparing the Revenue growth rate of the last years to the growth rate of the upcoming years, we see that the growth is accelerating.
Evaluating Valuation: NYSE:AGI
ChartMill assigns a Valuation Rating to each stock, ranging from 0 to 10. This rating is calculated by analyzing different valuation elements, such as price to earnings and free cash flow, both in absolute terms and relative to the market and industry. In the case of NYSE:AGI, the assigned 6 reflects its valuation:
- Compared to an average S&P500 Price/Forward Earnings ratio of 96.58, AGI is valued rather cheaply.
- Compared to the rest of the industry, the Price/Free Cash Flow ratio of AGI indicates a somewhat cheap valuation: AGI is cheaper than 66.43% of the companies listed in the same industry.
- AGI's low PEG Ratio(NY), which compensates the Price/Earnings for growth, indicates a rather cheap valuation of the company.
- The excellent profitability rating of AGI may justify a higher PE ratio.
- A more expensive valuation may be justified as AGI's earnings are expected to grow with 35.43% in the coming years.
Health Analysis for NYSE:AGI
Every stock is evaluated by ChartMill, receiving a Health Rating on a scale of 0 to 10. This assessment considers different health aspects, including liquidity and solvency, both in absolute terms and relative to industry peers. NYSE:AGI has achieved a 6 out of 10:
- AGI has an Altman-Z score of 3.42. This indicates that AGI is financially healthy and has little risk of bankruptcy at the moment.
- AGI has a better Altman-Z score (3.42) than 60.84% of its industry peers.
- The Debt to FCF ratio of AGI is 1.45, which is an excellent value as it means it would take AGI, only 1.45 years of fcf income to pay off all of its debts.
- Looking at the Debt to FCF ratio, with a value of 1.45, AGI belongs to the top of the industry, outperforming 81.82% of the companies in the same industry.
- AGI has a Debt/Equity ratio of 0.08. This is a healthy value indicating a solid balance between debt and equity.
- AGI's Debt to Equity ratio of 0.08 is fine compared to the rest of the industry. AGI outperforms 61.54% of its industry peers.
- AGI does not score too well on the current and quick ratio evaluation. However, as it has excellent solvency and profitability, these ratios do not necessarly indicate liquidity issues and need to be evaluated against the specifics of the business.
Exploring NYSE:AGI's Profitability
ChartMill assigns a proprietary Profitability Rating to each stock. The score is computed by evaluating various profitability ratios and margins and ranges from 0 to 10. NYSE:AGI was assigned a score of 8 for profitability:
- AGI's Return On Assets of 4.61% is fine compared to the rest of the industry. AGI outperforms 76.92% of its industry peers.
- With a decent Return On Equity value of 6.95%, AGI is doing good in the industry, outperforming 72.03% of the companies in the same industry.
- The Return On Invested Capital of AGI (6.72%) is better than 72.73% of its industry peers.
- The last Return On Invested Capital (6.72%) for AGI is above the 3 year average (5.43%), which is a sign of increasing profitability.
- AGI has a Profit Margin of 19.89%. This is amongst the best in the industry. AGI outperforms 90.21% of its industry peers.
- In the last couple of years the Profit Margin of AGI has grown nicely.
- AGI has a better Operating Margin (34.13%) than 90.91% of its industry peers.
- In the last couple of years the Operating Margin of AGI has grown nicely.
- AGI's Gross Margin of 45.64% is amongst the best of the industry. AGI outperforms 84.62% of its industry peers.
- In the last couple of years the Gross Margin of AGI has grown nicely.
Our Affordable Growth screener lists more Affordable Growth stocks and is updated daily.
Check the latest full fundamental report of AGI for a complete fundamental analysis.
Keep in mind
This article should in no way be interpreted as advice. The article is based on the observed metrics at the time of writing, but you should always make your own analysis and trade or invest at your own responsibility.
NYSE:AGI (2/19/2025, 2:49:05 PM)
22.75
+0.05 (+0.22%)
Find more stocks in the Stock Screener
AGI Latest News and Analysis
 6 days ago - ChartmillWhile growth is established for NYSE:AGI, the stock's valuation remains reasonable.
Discover ALAMOS GOLD INC-CLASS A, an undervalued growth gem. NYSE:AGI is shining in terms of growth metrics, and it's also displaying strong financial health and profitability, retaining an appealing valuation.
