Exploring the Growth Potential of NASDAQ:AAON as It Nears a Breakout.
By Mill Chart
Last update: Feb 20, 2025
In this article we will dive into AAON INC (NASDAQ:AAON) as a possible candidate for growth investing. Investors should always do their own research, but we noticed AAON INC showing up in our strong growth, ready to breakout screen, which makes it worth to investigate a bit more.
How We Gauge Growth for NASDAQ:AAON
Every stock receives a Growth Rating from ChartMill, ranging from 0 to 10. This rating assesses various growth aspects, including historical and projected EPS and revenue growth. NASDAQ:AAON boasts a 8 out of 10:
- AAON shows a strong growth in Earnings Per Share. Measured over the last years, the EPS has been growing by 22.06% yearly.
- The Revenue has grown by 8.32% in the past year. This is quite good.
- AAON shows a strong growth in Revenue. Measured over the last years, the Revenue has been growing by 21.91% yearly.
- Based on estimates for the next years, AAON will show a very strong growth in Earnings Per Share. The EPS will grow by 22.15% on average per year.
- AAON is expected to show quite a strong growth in Revenue. In the coming years, the Revenue will grow by 14.47% yearly.
Health Assessment of NASDAQ:AAON
Every stock is evaluated by ChartMill, receiving a Health Rating on a scale of 0 to 10. This assessment considers different health aspects, including liquidity and solvency, both in absolute terms and relative to industry peers. NASDAQ:AAON has achieved a 8 out of 10:
- AAON has an Altman-Z score of 27.10. This indicates that AAON is financially healthy and has little risk of bankruptcy at the moment.
- With an excellent Altman-Z score value of 27.10, AAON belongs to the best of the industry, outperforming 100.00% of the companies in the same industry.
- AAON has a debt to FCF ratio of 0.70. This is a very positive value and a sign of high solvency as it would only need 0.70 years to pay back of all of its debts.
- The Debt to FCF ratio of AAON (0.70) is better than 82.50% of its industry peers.
- A Debt/Equity ratio of 0.09 indicates that AAON is not too dependend on debt financing.
- AAON has a better Debt to Equity ratio (0.09) than 72.50% of its industry peers.
- A Current Ratio of 3.06 indicates that AAON has no problem at all paying its short term obligations.
- The Current ratio of AAON (3.06) is better than 77.50% of its industry peers.
- Looking at the Quick ratio, with a value of 1.79, AAON is in the better half of the industry, outperforming 70.00% of the companies in the same industry.
Profitability Assessment of NASDAQ:AAON
ChartMill's Profitability Rating offers a unique perspective on stock analysis, providing scores from 0 to 10. These ratings consider a wide range of profitability metrics and margins, both in comparison to industry peers and on their own merits. For NASDAQ:AAON, the assigned 9 is a significant indicator of profitability:
- Looking at the Return On Assets, with a value of 18.52%, AAON belongs to the top of the industry, outperforming 92.50% of the companies in the same industry.
- AAON has a better Return On Equity (23.96%) than 70.00% of its industry peers.
- AAON has a Return On Invested Capital of 21.71%. This is amongst the best in the industry. AAON outperforms 90.00% of its industry peers.
- The Average Return On Invested Capital over the past 3 years for AAON is above the industry average of 13.22%.
- The last Return On Invested Capital (21.71%) for AAON is above the 3 year average (15.91%), which is a sign of increasing profitability.
- AAON's Profit Margin of 15.78% is amongst the best of the industry. AAON outperforms 85.00% of its industry peers.
- In the last couple of years the Profit Margin of AAON has grown nicely.
- Looking at the Operating Margin, with a value of 20.14%, AAON belongs to the top of the industry, outperforming 85.00% of the companies in the same industry.
- In the last couple of years the Operating Margin of AAON has grown nicely.
- AAON's Gross Margin has improved in the last couple of years.
Why is NASDAQ:AAON a setup?
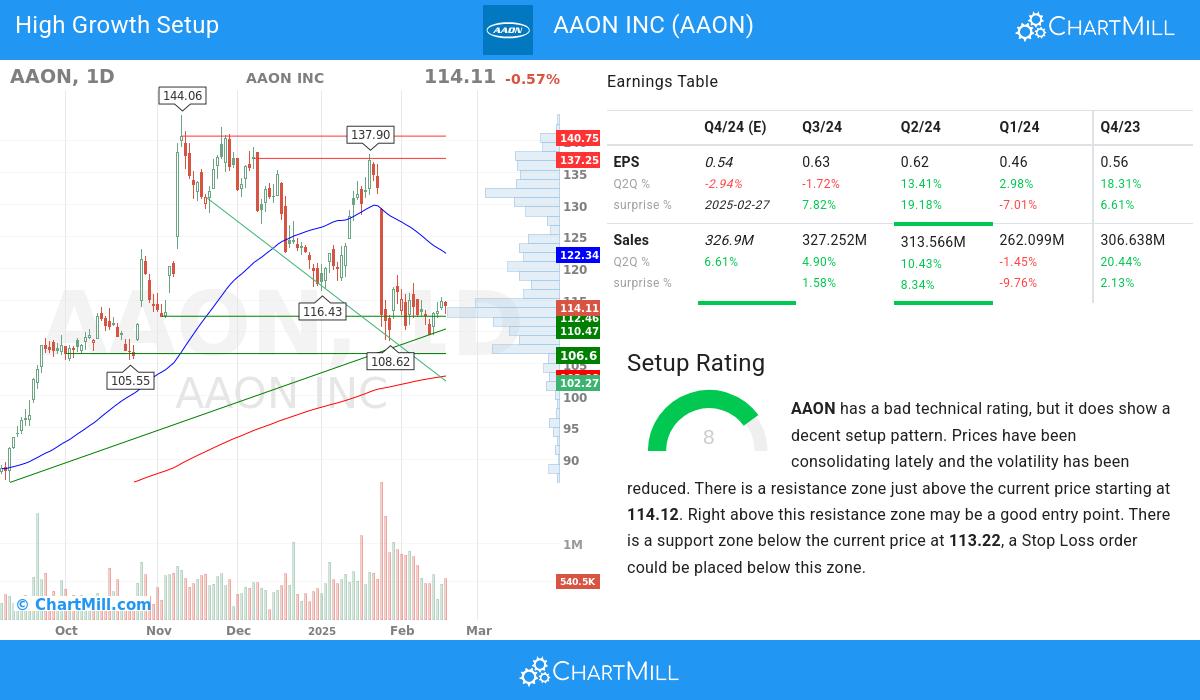
In addition to the Technical Rating, ChartMill provides a Setup Rating for each stock. This rating, ranging from 0 to 10, assesses the level of consolidation in the stock based on multiple short-term technical indicators. Currently, NASDAQ:AAON has a 8 as its setup rating, indicating its current consolidation status.
AAON has a bad technical rating, but it does show a decent setup pattern. Prices have been consolidating lately and the volatility has been reduced. There is a resistance zone just above the current price starting at 114.12. Right above this resistance zone may be a good entry point. There is a support zone below the current price at 113.22, a Stop Loss order could be placed below this zone.
Our Strong Growth screener lists more Strong Growth stocks and is updated daily.
For an up to date full fundamental analysis you can check the fundamental report of AAON
Our latest full technical report of AAON contains the most current technical analsysis.
Keep in mind
Important Note: The content of this article is not intended as trading advice. It is essential to perform your own analysis and exercise caution when making trading decisions. The article presents observations created by automated analysis but does not guarantee any trading or investment outcomes. Always trade responsibly and make independent judgments.
114.11
-0.65 (-0.57%)
Find more stocks in the Stock Screener
AAON Latest News and Analysis
 an hour ago - ChartmillExploring the Growth Potential of NASDAQ:AAON as It Nears a Breakout.
Based on a technical and fundamental analysis of NASDAQ:AAON we ask: Is AAON INC (NASDAQ:AAON) on the Verge of a Major Breakout as a Strong Growth Stock?
