
NYSE:ZTO, an undervalued stock with good fundamentals.
By Mill Chart
Last update: Oct 9, 2024
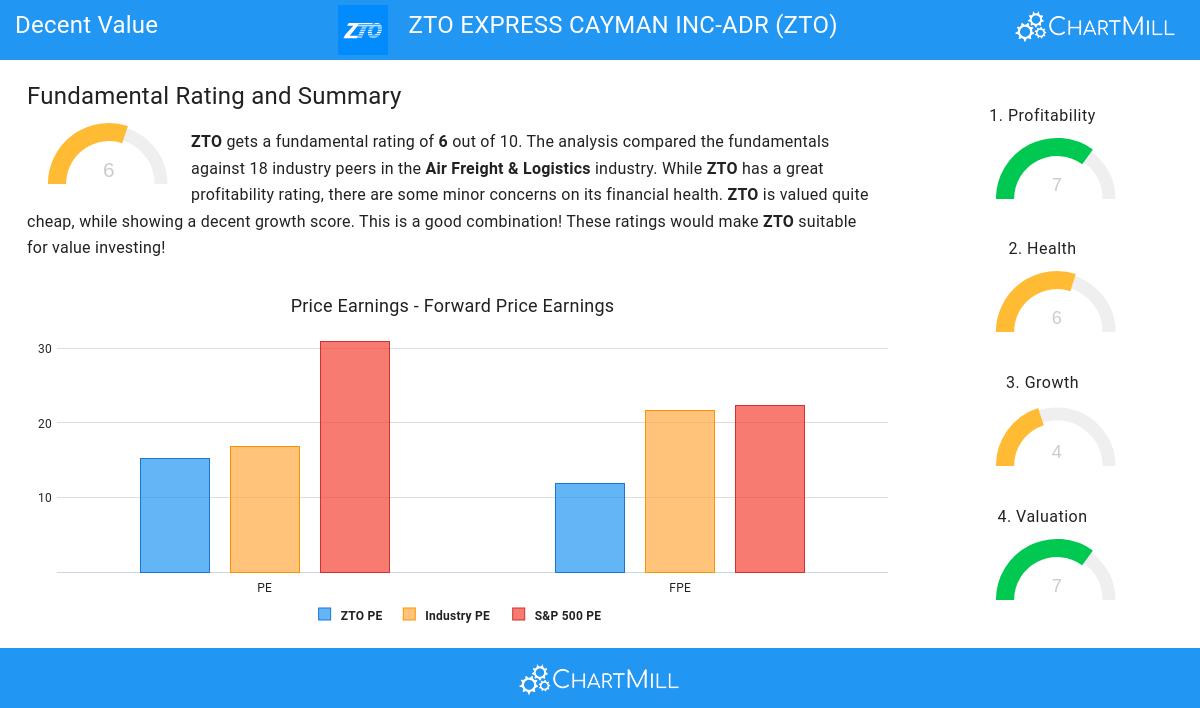
Uncover the potential of ZTO EXPRESS CAYMAN INC-ADR (NYSE:ZTO) as our stock screener's choice for an undervalued stock. NYSE:ZTO maintains a strong financial position and offers an appealing valuation. We'll delve into the specifics below.
How We Gauge Valuation for NYSE:ZTO
An integral part of ChartMill's stock analysis is the Valuation Rating, which spans from 0 to 10. This rating evaluates diverse valuation factors, including price to earnings and cash flows, while considering the stock's profitability and growth. NYSE:ZTO has received a 7 out of 10:
- 72.22% of the companies in the same industry are more expensive than ZTO, based on the Price/Earnings ratio.
- When comparing the Price/Earnings ratio of ZTO to the average of the S&P500 Index (30.97), we can say ZTO is valued rather cheaply.
- ZTO is valuated reasonably with a Price/Forward Earnings ratio of 11.90.
- Compared to the rest of the industry, the Price/Forward Earnings ratio of ZTO indicates a rather cheap valuation: ZTO is cheaper than 88.89% of the companies listed in the same industry.
- ZTO is valuated rather cheaply when we compare the Price/Forward Earnings ratio to 22.29, which is the current average of the S&P500 Index.
- 66.67% of the companies in the same industry are more expensive than ZTO, based on the Enterprise Value to EBITDA ratio.
- Based on the Price/Free Cash Flow ratio, ZTO is valued a bit cheaper than the industry average as 77.78% of the companies are valued more expensively.
- ZTO's low PEG Ratio(NY), which compensates the Price/Earnings for growth, indicates a rather cheap valuation of the company.
- The decent profitability rating of ZTO may justify a higher PE ratio.
- ZTO's earnings are expected to grow with 16.60% in the coming years. This may justify a more expensive valuation.
Profitability Insights: NYSE:ZTO
ChartMill utilizes a Profitability Rating to assess stocks, scoring them on a scale of 0 to 10. This rating takes into account a variety of profitability ratios and margins, both in absolute terms and in comparison to industry peers. NYSE:ZTO has earned a 7 out of 10:
- Looking at the Return On Assets, with a value of 9.41%, ZTO belongs to the top of the industry, outperforming 83.33% of the companies in the same industry.
- The Return On Equity of ZTO (14.19%) is better than 72.22% of its industry peers.
- Looking at the Return On Invested Capital, with a value of 10.88%, ZTO is in the better half of the industry, outperforming 77.78% of the companies in the same industry.
- The last Return On Invested Capital (10.88%) for ZTO is above the 3 year average (9.42%), which is a sign of increasing profitability.
- ZTO's Profit Margin of 21.24% is amongst the best of the industry. ZTO outperforms 100.00% of its industry peers.
- ZTO has a Operating Margin of 26.40%. This is amongst the best in the industry. ZTO outperforms 100.00% of its industry peers.
- With a decent Gross Margin value of 30.85%, ZTO is doing good in the industry, outperforming 66.67% of the companies in the same industry.
Unpacking NYSE:ZTO's Health Rating
ChartMill assigns a Health Rating to every stock. This score ranges from 0 to 10 and evaluates the different health aspects like liquidity and solvency, both absolutely, but also relative to the industry peers. NYSE:ZTO scores a 6 out of 10:
- An Altman-Z score of 4.35 indicates that ZTO is not in any danger for bankruptcy at the moment.
- Looking at the Altman-Z score, with a value of 4.35, ZTO is in the better half of the industry, outperforming 77.78% of the companies in the same industry.
- The Debt to FCF ratio of ZTO is 1.73, which is an excellent value as it means it would take ZTO, only 1.73 years of fcf income to pay off all of its debts.
- Looking at the Debt to FCF ratio, with a value of 1.73, ZTO is in the better half of the industry, outperforming 77.78% of the companies in the same industry.
- ZTO has a Debt/Equity ratio of 0.29. This is a healthy value indicating a solid balance between debt and equity.
- With a decent Debt to Equity ratio value of 0.29, ZTO is doing good in the industry, outperforming 66.67% of the companies in the same industry.
- ZTO's Quick ratio of 1.26 is fine compared to the rest of the industry. ZTO outperforms 61.11% of its industry peers.
Growth Assessment of NYSE:ZTO
ChartMill employs its own Growth Rating system for all stocks. This score, ranging from 0 to 10, is derived by evaluating different growth factors, such as EPS and revenue growth, taking into account both past performance and future projections. NYSE:ZTO has earned a 4 for growth:
- The Earnings Per Share has grown by an nice 14.68% over the past year.
- The Earnings Per Share has been growing by 12.36% on average over the past years. This is quite good.
- Measured over the past years, ZTO shows a quite strong growth in Revenue. The Revenue has been growing by 16.89% on average per year.
Our Decent Value screener lists more Decent Value stocks and is updated daily.
For an up to date full fundamental analysis you can check the fundamental report of ZTO
Keep in mind
This is not investing advice! The article highlights some of the observations at the time of writing, but you should always make your own analysis and invest based on your own insights.
NYSE:ZTO (3/5/2025, 2:02:05 PM)
20.85
+0.26 (+1.26%)
Find more stocks in the Stock Screener
