
For those who appreciate growth without the sticker shock, NYSE:YOU is worth considering.
By Mill Chart
Last update: Jan 28, 2025
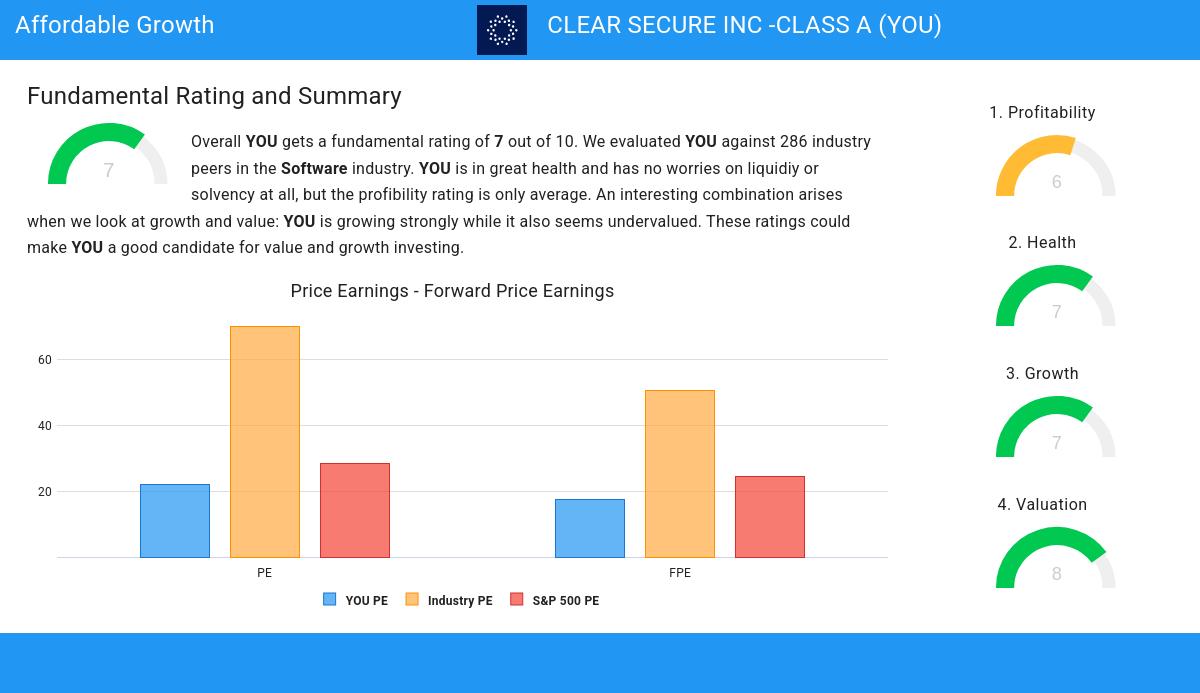
Consider CLEAR SECURE INC -CLASS A (NYSE:YOU) as an affordable growth stock, identified by our stock screening tool. NYSE:YOU is showcasing impressive growth figures and is well-positioned in terms of profitability, solvency, and liquidity. Moreover, it seems to be priced reasonably. Let's dive deeper into the analysis.
A Closer Look at Growth for NYSE:YOU
A key component of ChartMill's stock assessment is the Growth Rating, which spans from 0 to 10. This rating evaluates diverse growth factors, such as EPS and revenue growth, considering both past performance and future projections. NYSE:YOU has received a 7 out of 10:
- The Earnings Per Share has grown by an impressive 94.64% over the past year.
- YOU shows a strong growth in Revenue. In the last year, the Revenue has grown by 28.75%.
- Measured over the past years, YOU shows a very strong growth in Revenue. The Revenue has been growing by 38.53% on average per year.
- YOU is expected to show a strong growth in Earnings Per Share. In the coming years, the EPS will grow by 42.04% yearly.
- YOU is expected to show quite a strong growth in Revenue. In the coming years, the Revenue will grow by 16.80% yearly.
Understanding NYSE:YOU's Valuation Score
ChartMill provides a Valuation Rating to every stock, ranging from 0 to 10. This rating assesses various valuation aspects, comparing price to earnings and cash flows, while considering factors like profitability and growth. NYSE:YOU boasts a 8 out of 10:
- Compared to the rest of the industry, the Price/Earnings ratio of YOU indicates a rather cheap valuation: YOU is cheaper than 80.65% of the companies listed in the same industry.
- Compared to an average S&P500 Price/Earnings ratio of 28.39, YOU is valued a bit cheaper.
- Compared to the rest of the industry, the Price/Forward Earnings ratio of YOU indicates a rather cheap valuation: YOU is cheaper than 82.80% of the companies listed in the same industry.
- YOU's Price/Forward Earnings ratio indicates a valuation a bit cheaper than the S&P500 average which is at 24.37.
- Compared to the rest of the industry, the Enterprise Value to EBITDA ratio of YOU indicates a rather cheap valuation: YOU is cheaper than 85.30% of the companies listed in the same industry.
- Based on the Price/Free Cash Flow ratio, YOU is valued cheaper than 92.83% of the companies in the same industry.
- The low PEG Ratio(NY), which compensates the Price/Earnings for growth, indicates a rather cheap valuation of the company.
- YOU has a very decent profitability rating, which may justify a higher PE ratio.
- A more expensive valuation may be justified as YOU's earnings are expected to grow with 42.04% in the coming years.
Evaluating Health: NYSE:YOU
ChartMill utilizes a Health Rating to assess stocks, scoring them on a scale of 0 to 10. This rating takes into account a variety of liquidity and solvency ratios, both in absolute terms and in comparison to industry peers. NYSE:YOU has earned a 7 out of 10:
- An Altman-Z score of 4.05 indicates that YOU is not in any danger for bankruptcy at the moment.
- YOU has no outstanding debt. Therefor its Debt/Equity and Debt/FCF ratios are 0 and belong to the best of the industry.
What does the Profitability looks like for NYSE:YOU
ChartMill utilizes a Profitability Rating to assess stocks, scoring them on a scale of 0 to 10. This rating takes into account a variety of profitability ratios and margins, both in absolute terms and in comparison to industry peers. NYSE:YOU has earned a 6 out of 10:
- With an excellent Return On Assets value of 9.36%, YOU belongs to the best of the industry, outperforming 86.02% of the companies in the same industry.
- YOU has a Return On Equity of 62.31%. This is amongst the best in the industry. YOU outperforms 97.49% of its industry peers.
- YOU has a Return On Invested Capital of 27.28%. This is amongst the best in the industry. YOU outperforms 97.13% of its industry peers.
- YOU's Profit Margin of 10.93% is fine compared to the rest of the industry. YOU outperforms 77.78% of its industry peers.
- YOU has a better Operating Margin (14.14%) than 82.80% of its industry peers.
- The Gross Margin of YOU (85.52%) is better than 92.11% of its industry peers.
More Affordable Growth stocks can be found in our Affordable Growth screener.
For an up to date full fundamental analysis you can check the fundamental report of YOU
Keep in mind
This article should in no way be interpreted as advice. The article is based on the observed metrics at the time of writing, but you should always make your own analysis and trade or invest at your own responsibility.