NYSE:YETI is a prime example of a stock that offers more than what meets the eye in terms of fundamentals.
By Mill Chart
Last update: Feb 6, 2025
Consider YETI HOLDINGS INC (NYSE:YETI) as a top value stock, identified by our stock screening tool. NYSE:YETI shines in terms of profitability, solvency, and liquidity, all while remaining very reasonably priced. Let's dive deeper into the analysis.
Understanding NYSE:YETI's Valuation Score
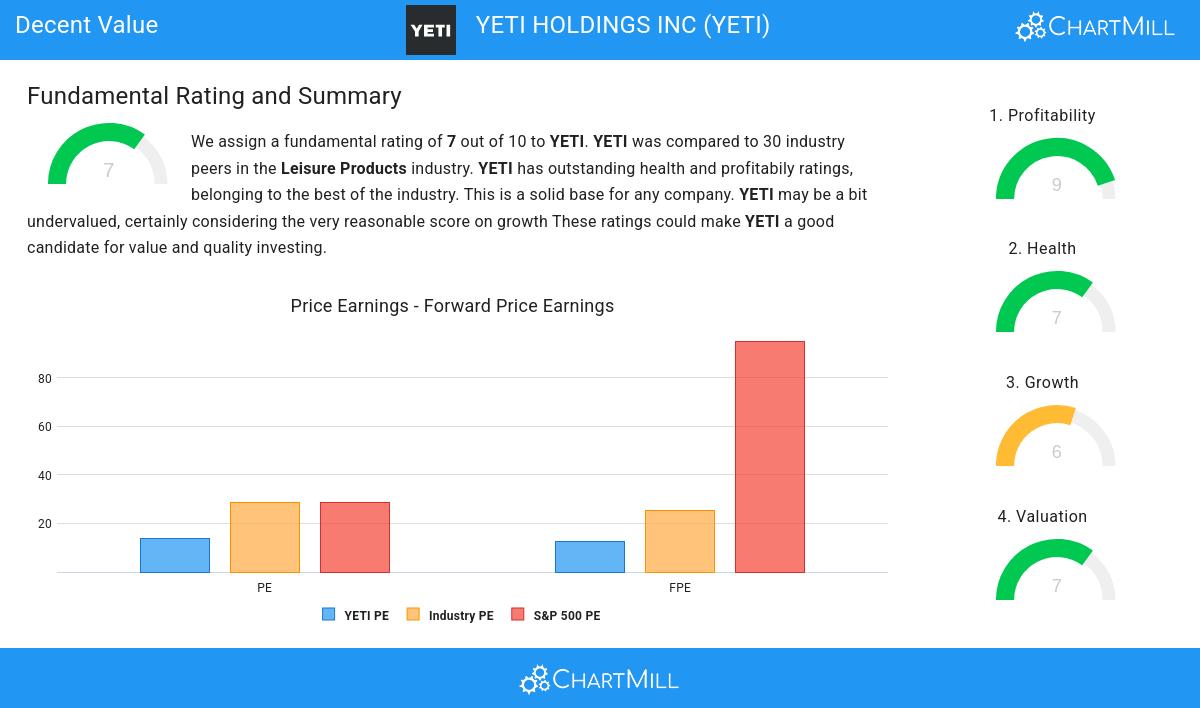
ChartMill assigns a Valuation Rating to each stock, ranging from 0 to 10. This rating is calculated by analyzing different valuation elements, such as price to earnings and free cash flow, both in absolute terms and relative to the market and industry. In the case of NYSE:YETI, the assigned 7 reflects its valuation:
- Based on the Price/Earnings ratio, YETI is valued cheaper than 83.33% of the companies in the same industry.
- The average S&P500 Price/Earnings ratio is at 28.58. YETI is valued rather cheaply when compared to this.
- Based on the Price/Forward Earnings ratio, YETI is valued a bit cheaper than 80.00% of the companies in the same industry.
- YETI's Price/Forward Earnings ratio indicates a rather cheap valuation when compared to the S&P500 average which is at 95.03.
- Based on the Enterprise Value to EBITDA ratio, YETI is valued a bit cheaper than 73.33% of the companies in the same industry.
- The low PEG Ratio(NY), which compensates the Price/Earnings for growth, indicates a rather cheap valuation of the company.
- The excellent profitability rating of YETI may justify a higher PE ratio.
- A more expensive valuation may be justified as YETI's earnings are expected to grow with 13.22% in the coming years.
How do we evaluate the Profitability for NYSE:YETI?
ChartMill employs its own Profitability Rating system for stock evaluation. This score, ranging from 0 to 10, is derived from an analysis of diverse profitability metrics and margins. In the case of NYSE:YETI, the assigned 9 is noteworthy for profitability:
- YETI's Return On Assets of 15.80% is amongst the best of the industry. YETI outperforms 100.00% of its industry peers.
- YETI has a Return On Equity of 26.12%. This is amongst the best in the industry. YETI outperforms 96.67% of its industry peers.
- YETI's Return On Invested Capital of 21.12% is amongst the best of the industry. YETI outperforms 100.00% of its industry peers.
- The Average Return On Invested Capital over the past 3 years for YETI is significantly above the industry average of 8.10%.
- The Profit Margin of YETI (11.15%) is better than 100.00% of its industry peers.
- YETI's Profit Margin has improved in the last couple of years.
- Looking at the Operating Margin, with a value of 14.53%, YETI belongs to the top of the industry, outperforming 96.67% of the companies in the same industry.
- YETI's Gross Margin of 58.35% is amongst the best of the industry. YETI outperforms 90.00% of its industry peers.
- YETI's Gross Margin has improved in the last couple of years.
Health Analysis for NYSE:YETI
ChartMill employs its own Health Rating for stock assessment. This rating, ranging from 0 to 10, is calculated by examining various liquidity and solvency ratios. In the case of NYSE:YETI, the assigned 7 reflects its health status:
- An Altman-Z score of 6.94 indicates that YETI is not in any danger for bankruptcy at the moment.
- YETI has a better Altman-Z score (6.94) than 90.00% of its industry peers.
- YETI has a debt to FCF ratio of 0.49. This is a very positive value and a sign of high solvency as it would only need 0.49 years to pay back of all of its debts.
- YETI has a Debt to FCF ratio of 0.49. This is amongst the best in the industry. YETI outperforms 86.67% of its industry peers.
- A Debt/Equity ratio of 0.10 indicates that YETI is not too dependend on debt financing.
- YETI has a Current Ratio of 2.58. This indicates that YETI is financially healthy and has no problem in meeting its short term obligations.
Assessing Growth Metrics for NYSE:YETI
ChartMill employs its own Growth Rating system for all stocks. This score, ranging from 0 to 10, is derived by evaluating different growth factors, such as EPS and revenue growth, taking into account both past performance and future projections. NYSE:YETI has earned a 6 for growth:
- The Earnings Per Share has grown by an impressive 24.41% over the past year.
- Measured over the past years, YETI shows a very strong growth in Earnings Per Share. The EPS has been growing by 23.01% on average per year.
- The Revenue has grown by 13.62% in the past year. This is quite good.
- Measured over the past years, YETI shows a quite strong growth in Revenue. The Revenue has been growing by 16.32% on average per year.
- The Earnings Per Share is expected to grow by 12.98% on average over the next years. This is quite good.
Every day, new Decent Value stocks can be found on ChartMill in our Decent Value screener.
Check the latest full fundamental report of YETI for a complete fundamental analysis.
Keep in mind
This article should in no way be interpreted as advice. The article is based on the observed metrics at the time of writing, but you should always make your own analysis and trade or invest at your own responsibility.
YETI HOLDINGS INC
NYSE:YETI (2/6/2025, 8:21:30 PM)
After market: 37.39 0 (0%)37.39
+0.41 (+1.11%)
YETI Latest News and Analysis
 a day ago - ChartmillNYSE:YETI is a prime example of a stock that offers more than what meets the eye in terms of fundamentals.
YETI HOLDINGS INC has caught the attention as a great value stock. NYSE:YETI excels in profitability, solvency, and liquidity, all while being very reasonably priced.
