
Exploring XYLEM INC (NYSE:XYL)'s dividend characteristics.
By Mill Chart
Last update: Mar 8, 2025
XYLEM INC (NYSE:XYL) was identified as a stock worth exploring by dividend investors by our stock screener. NYSE:XYL scores well on profitability, solvency and liquidity. At the same time it seems to pay a decent dividend. We'll explore this a bit deeper below.
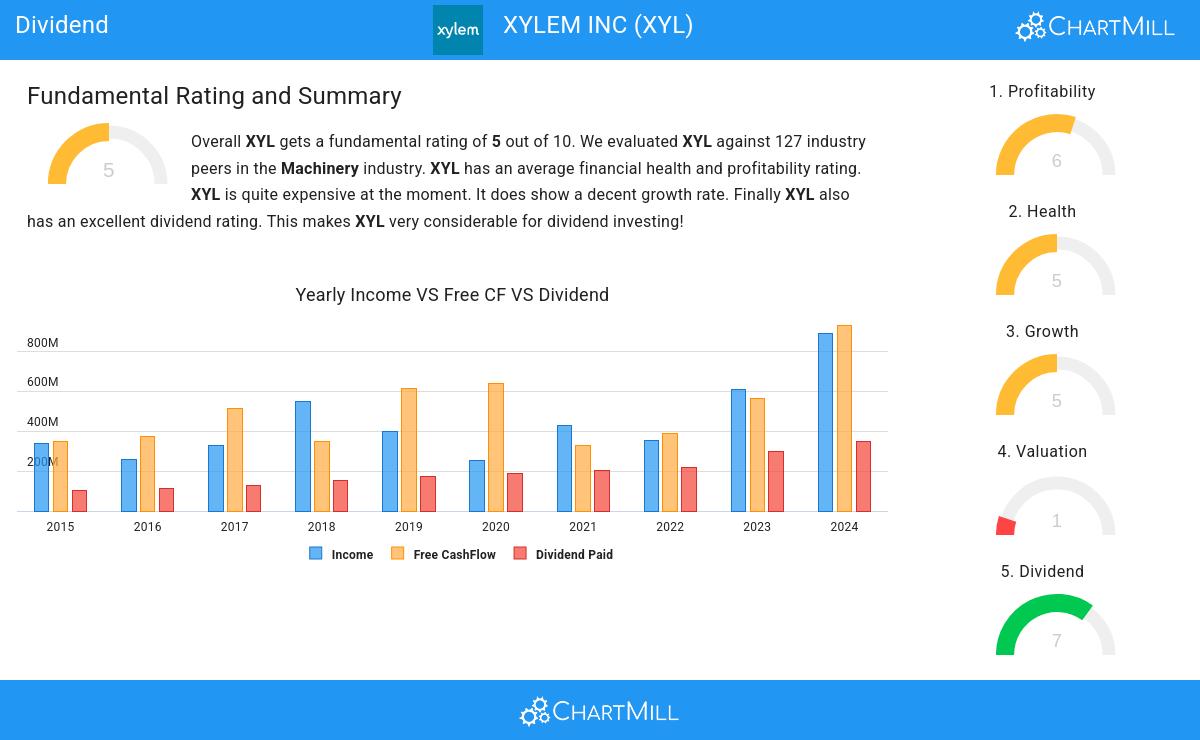
What does the Dividend looks like for NYSE:XYL
ChartMill assigns a proprietary Dividend Rating to each stock. The score is computed by evaluating various valuation aspects, like the yield, the history, the dividend growth and sustainability. NYSE:XYL was assigned a score of 7 for dividend:
- Compared to an average industry Dividend Yield of 1.75, XYL pays a bit more dividend than its industry peers.
- The dividend of XYL is nicely growing with an annual growth rate of 8.36%!
- XYL has paid a dividend for at least 10 years, which is a reliable track record.
- XYL has not decreased their dividend for at least 10 years, which is a reliable track record.
- 39.33% of the earnings are spent on dividend by XYL. This is a low number and sustainable payout ratio.
- XYL's earnings are growing more than its dividend. This makes the dividend growth sustainable.
A Closer Look at Health for NYSE:XYL
A critical element of ChartMill's stock evaluation is the Health Rating, which spans from 0 to 10. This rating considers multiple health factors, including liquidity and solvency, both in absolute terms and relative to industry peers. NYSE:XYL has received a 5 out of 10:
- An Altman-Z score of 4.34 indicates that XYL is not in any danger for bankruptcy at the moment.
- XYL's Altman-Z score of 4.34 is fine compared to the rest of the industry. XYL outperforms 71.65% of its industry peers.
- The Debt to FCF ratio of XYL is 2.17, which is a good value as it means it would take XYL, 2.17 years of fcf income to pay off all of its debts.
- Looking at the Debt to FCF ratio, with a value of 2.17, XYL is in the better half of the industry, outperforming 78.74% of the companies in the same industry.
- A Debt/Equity ratio of 0.19 indicates that XYL is not too dependend on debt financing.
- The Debt to Equity ratio of XYL (0.19) is better than 71.65% of its industry peers.
Looking at the Profitability
ChartMill assigns a Profitability Rating to every stock. This score ranges from 0 to 10 and evaluates the different profitability ratios and margins, both absolutely, but also relative to the industry peers. NYSE:XYL scores a 6 out of 10:
- With a decent Profit Margin value of 10.39%, XYL is doing good in the industry, outperforming 70.87% of the companies in the same industry.
- In the last couple of years the Profit Margin of XYL has grown nicely.
- XYL has a Operating Margin of 12.51%. This is in the better half of the industry: XYL outperforms 62.99% of its industry peers.
- XYL has a better Gross Margin (37.51%) than 66.14% of its industry peers.
More Best Dividend stocks can be found in our Best Dividend screener.
Check the latest full fundamental report of XYL for a complete fundamental analysis.
Disclaimer
This article should in no way be interpreted as advice. The article is based on the observed metrics at the time of writing, but you should always make your own analysis and trade or invest at your own responsibility.
