
Is EXXON MOBIL CORP (NYSE:XOM) a Good Fit for Dividend Investing?
By Mill Chart
Last update: Mar 4, 2025
Consider EXXON MOBIL CORP (NYSE:XOM) as a top pick for dividend investors, identified by our stock screening tool. NYSE:XOM shines in terms of profitability, solvency, and liquidity, all while paying a decent dividend. Let's dive deeper into the analysis.
Understanding NYSE:XOM's Dividend
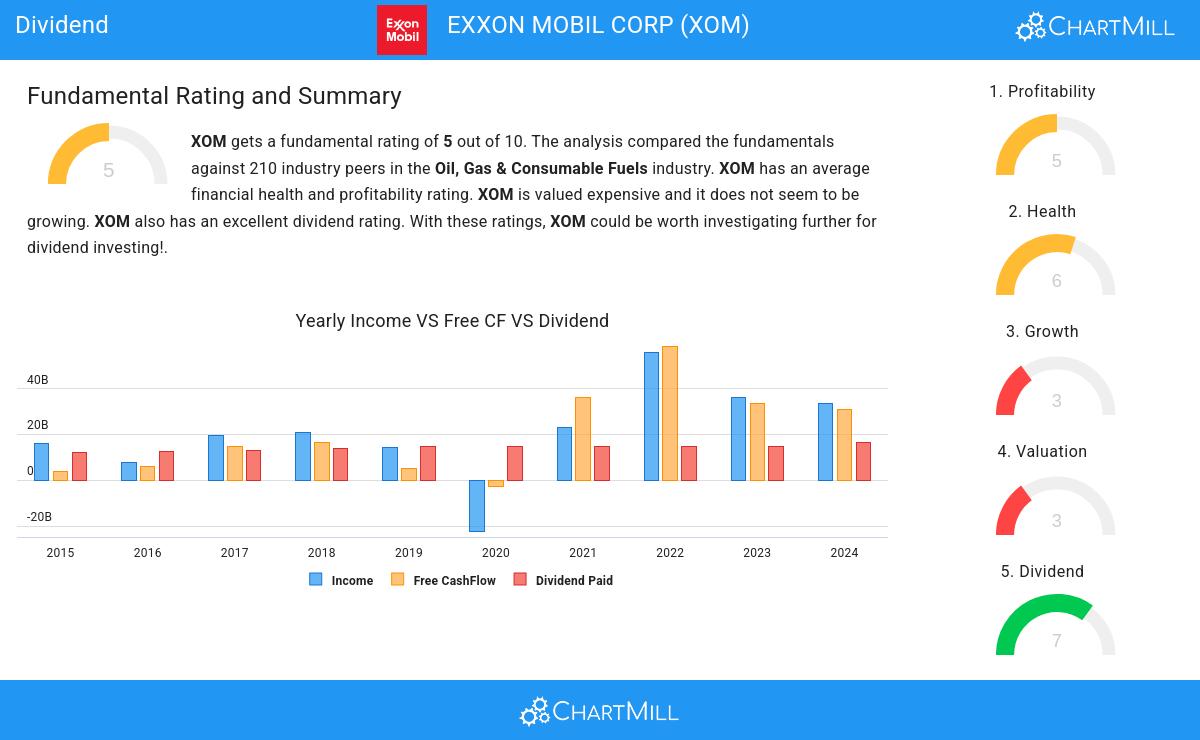
An integral part of ChartMill's stock analysis is the Dividend Rating, which spans from 0 to 10. This rating evaluates diverse dividend factors, including yield, historical data, growth, and sustainability. NYSE:XOM has received a 7 out of 10:
- Compared to an average S&P500 Dividend Yield of 2.30, XOM pays a better dividend.
- XOM has been paying a dividend for at least 10 years, so it has a reliable track record.
- XOM has not decreased its dividend for at least 10 years, so it has a reliable track record of non decreasing dividend.
- The dividend of XOM is growing, but earnings are growing more, so the dividend growth is sustainable.
Health Assessment of NYSE:XOM
Every stock is evaluated by ChartMill, receiving a Health Rating on a scale of 0 to 10. This assessment considers different health aspects, including liquidity and solvency, both in absolute terms and relative to industry peers. NYSE:XOM has achieved a 6 out of 10:
- An Altman-Z score of 4.06 indicates that XOM is not in any danger for bankruptcy at the moment.
- Looking at the Altman-Z score, with a value of 4.06, XOM belongs to the top of the industry, outperforming 87.19% of the companies in the same industry.
- XOM has a debt to FCF ratio of 1.36. This is a very positive value and a sign of high solvency as it would only need 1.36 years to pay back of all of its debts.
- XOM's Debt to FCF ratio of 1.36 is amongst the best of the industry. XOM outperforms 84.73% of its industry peers.
- A Debt/Equity ratio of 0.14 indicates that XOM is not too dependend on debt financing.
- Looking at the Debt to Equity ratio, with a value of 0.14, XOM is in the better half of the industry, outperforming 74.88% of the companies in the same industry.
Profitability Analysis for NYSE:XOM
ChartMill assigns a Profitability Rating to every stock. This score ranges from 0 to 10 and evaluates the different profitability ratios and margins, both absolutely, but also relative to the industry peers. NYSE:XOM scores a 5 out of 10:
- XOM has a better Return On Assets (7.43%) than 67.49% of its industry peers.
- XOM has a better Return On Equity (12.77%) than 60.59% of its industry peers.
- In the last couple of years the Profit Margin of XOM has grown nicely.
- In the last couple of years the Operating Margin of XOM has grown nicely.
Every day, new Best Dividend stocks can be found on ChartMill in our Best Dividend screener.
For an up to date full fundamental analysis you can check the fundamental report of XOM
Keep in mind
This article should in no way be interpreted as advice. The article is based on the observed metrics at the time of writing, but you should always make your own analysis and trade or invest at your own responsibility.
117.76
-1.06 (-0.89%)
Find more stocks in the Stock Screener
XOM Latest News and Analysis


