Promising Signs: WILLIAMS COS INC Setting the Stage for a Breakout.
By Mill Chart
Last update: Feb 24, 2025
A possible breakout setup was detected on WILLIAMS COS INC (NYSE:WMB) by our stockscreener. A breakout pattern is formed when a stock consolidates after a strong rise up. We note that this pattern is detected purely based on technical analysis and whether the breakout actually materializes remains to be seen. It could be interesting to keep an eye on NYSE:WMB.
Technical Analysis Observations
Every day ChartMill assigns a Technical Rating to every stock. The score ranges from 0 to 10 and is determined by evaluating multiple technical indicators and properties.
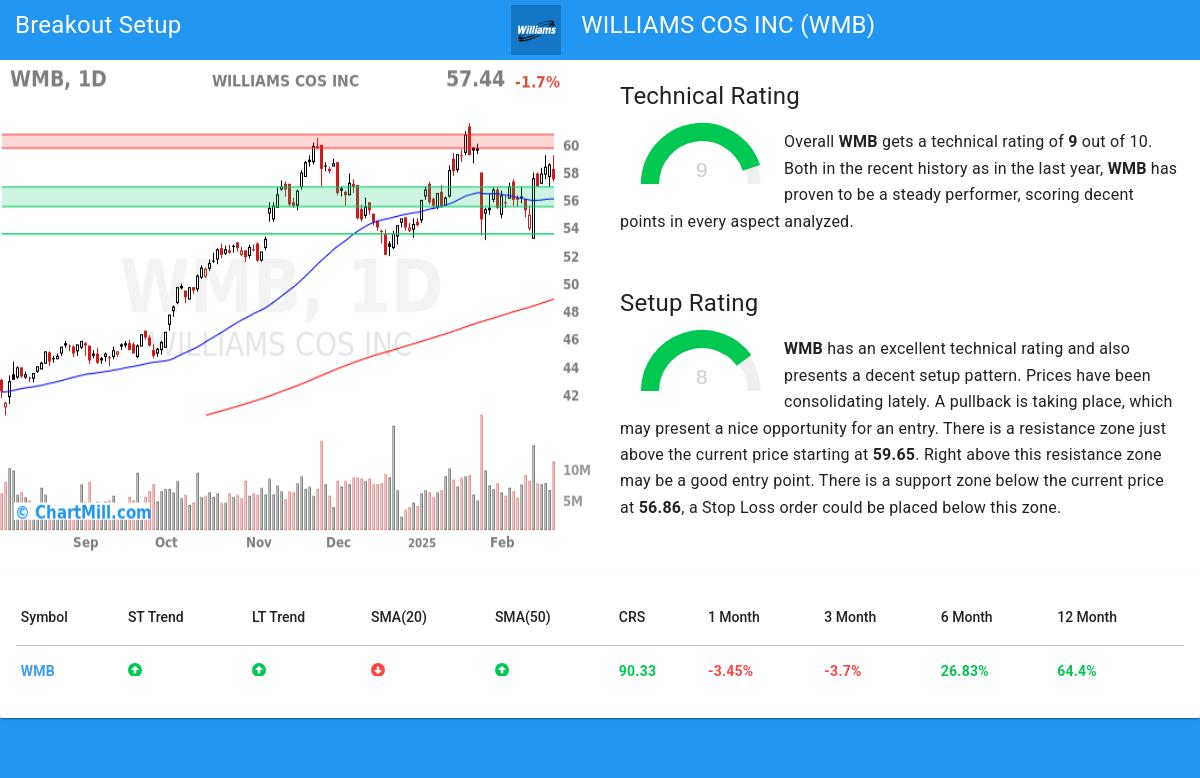
Taking everything into account, WMB scores 9 out of 10 in our technical rating. This is due to a consistent performance in both the short and longer term time frames. Also compared to the overall market, WMB is showing a nice and steady performance.
- Both the short term and long term trends are positive. This is a very positive sign.
- Looking at the yearly performance, WMB did better than 90% of all other stocks. On top of that, WMB also shows a nice and consistent pattern of rising prices.
- WMB is one of the better performing stocks in the Oil, Gas & Consumable Fuels industry, it outperforms 90% of 210 stocks in the same industry.
- WMB is currently trading in the upper part of its 52 week range. The S&P500 Index however is currently trading near a new high, so WMB is lagging the market slightly.
- In the last month WMB has a been trading in the 53.04 - 60.00 range, which is quite wide. It is currently trading near the high of this range.
- Prices have been consolidating recently, this may present a good entry opportunity.
Check the latest full technical report of WMB for a complete technical analysis.
How do we evaluate the setup for NYSE:WMB?
Besides the Technical Rating, ChartMill assigns a Setup Rating to every stock to determine the degree of consolidation. This rating, ranging from 0 to 10, is updated daily and evaluates various short-term technical indicators. NYSE:WMB currently holds a 8 as its setup rating, suggesting a particular level of consolidation in the stock.
Besides having an excellent technical rating, WMB also presents a decent setup pattern. Prices have been consolidating lately. A pullback is taking place, which may present a nice opportunity for an entry. There is a resistance zone just above the current price starting at 59.65. Right above this resistance zone may be a good entry point. There is a support zone below the current price at 56.86, a Stop Loss order could be placed below this zone.
How can NYSE:WMB be traded?
One way to play this would be to wait for the actual breakout to happen and buy when the stock breaks out above the current consolidation zone. A possible place for a stop loss would be below this zone.
This article should in no way be interpreted as trading advice. You should always make your own analysis and trade or not trade based on your own observations and style. The article is based purely on some technical observations.
Every day, new breakout setups can be found on ChartMill in our Breakout screener.
Keep in mind
This is not investing advice! The article highlights some of the observations at the time of writing, but you should always make your own analysis and invest based on your own insights.
57.44
-1.01 (-1.73%)
Find more stocks in the Stock Screener
WMB Latest News and Analysis
 2 minutes ago - ChartmillPromising Signs: WILLIAMS COS INC Setting the Stage for a Breakout.
Exploring WILLIAMS COS INC's Technical Signals and Breakout Potential: WILLIAMS COS INC is showing promising signs of setting up for a breakout.
 20 days ago - ChartmillStay updated with the S&P500 stocks that are on the move in today's after-hours session.
After the closing bell on Tuesday, let's take a glimpse of the US markets and explore the top S&P500 gainers and losers in today's after-hours session.
