Exploring WINNEBAGO INDUSTRIES (NYSE:WGO)'s dividend characteristics.
By Mill Chart
Last update: Apr 28, 2025
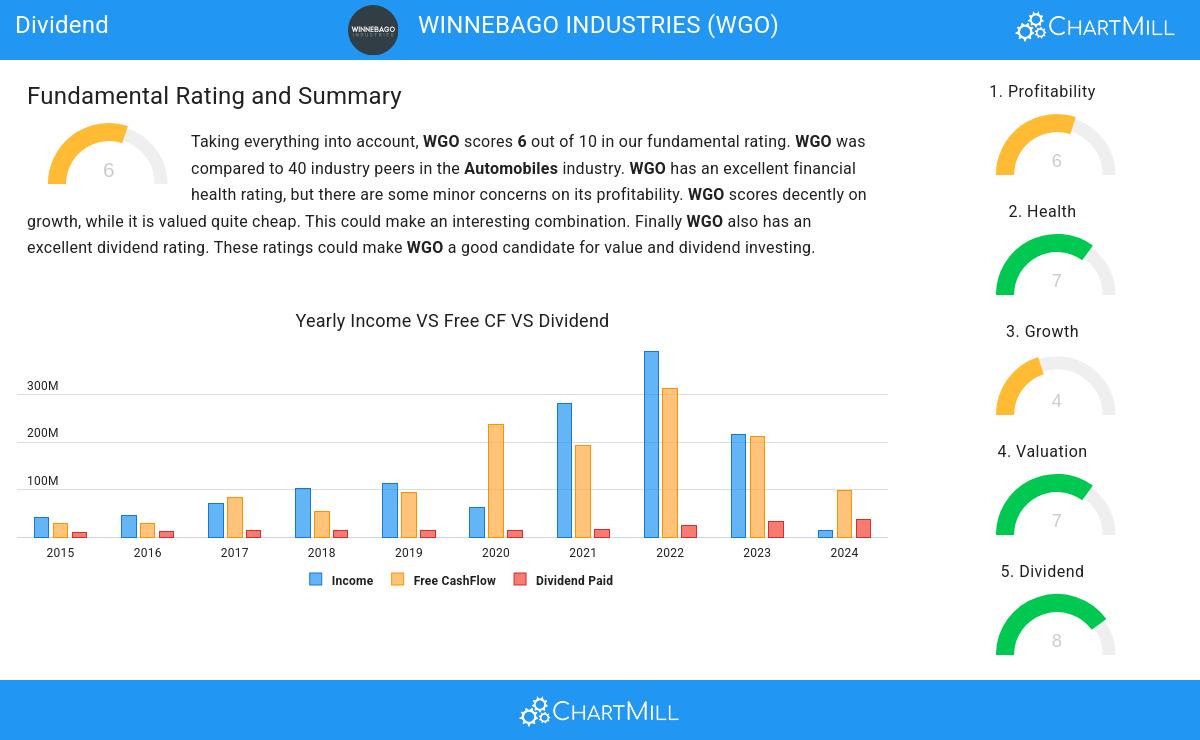
Our stock screener has spotted WINNEBAGO INDUSTRIES (NYSE:WGO) as a good dividend stock with solid fundamentals. WGO shows decent health and profitability. At the same time it gives a good and sustainable dividend. We'll dive into each aspect below.
A Closer Look at Dividend for WGO
To gauge a stock's dividend quality, ChartMill utilizes a Dividend Rating ranging from 0 to 10. This comprehensive assessment considers various dividend aspects, including yield, history, growth, and sustainability. WGO has achieved a 8 out of 10:
- With a Yearly Dividend Yield of 4.14%, WGO is a good candidate for dividend investing.
- Compared to an average industry Dividend Yield of 3.79, WGO pays a better dividend. On top of this WGO pays more dividend than 92.50% of the companies listed in the same industry.
- Compared to an average S&P500 Dividend Yield of 2.46, WGO pays a better dividend.
- On average, the dividend of WGO grows each year by 23.63%, which is quite nice.
- WGO has been paying a dividend for at least 10 years, so it has a reliable track record.
- WGO has not decreased their dividend for at least 10 years, which is a reliable track record.
Analyzing Health Metrics
ChartMill assigns a Health Rating to every stock. This score ranges from 0 to 10 and evaluates the different health aspects like liquidity and solvency, both absolutely, but also relative to the industry peers. WGO scores a 7 out of 10:
- An Altman-Z score of 3.24 indicates that WGO is not in any danger for bankruptcy at the moment.
- With an excellent Altman-Z score value of 3.24, WGO belongs to the best of the industry, outperforming 87.50% of the companies in the same industry.
- With an excellent Debt to FCF ratio value of 8.28, WGO belongs to the best of the industry, outperforming 85.00% of the companies in the same industry.
- WGO has a Debt/Equity ratio of 0.44. This is a healthy value indicating a solid balance between debt and equity.
- With a decent Debt to Equity ratio value of 0.44, WGO is doing good in the industry, outperforming 62.50% of the companies in the same industry.
- A Current Ratio of 2.17 indicates that WGO has no problem at all paying its short term obligations.
- WGO has a Current ratio of 2.17. This is amongst the best in the industry. WGO outperforms 82.50% of its industry peers.
Understanding WGO's Profitability
ChartMill assigns a proprietary Profitability Rating to each stock. The score is computed by evaluating various profitability ratios and margins and ranges from 0 to 10. WGO was assigned a score of 6 for profitability:
- The Return On Assets of WGO (-0.26%) is better than 70.00% of its industry peers.
- WGO has a better Return On Equity (-0.47%) than 70.00% of its industry peers.
- WGO has a Return On Invested Capital of 2.73%. This is in the better half of the industry: WGO outperforms 72.50% of its industry peers.
- WGO had an Average Return On Invested Capital over the past 3 years of 13.73%. This is significantly above the industry average of 6.82%.
- The 3 year average ROIC (13.73%) for WGO is well above the current ROIC(2.73%). The reason for the recent decline needs to be investigated.
- With a decent Operating Margin value of 2.29%, WGO is doing good in the industry, outperforming 70.00% of the companies in the same industry.
More Best Dividend stocks can be found in our Best Dividend screener.
For an up to date full fundamental analysis you can check the fundamental report of WGO
Disclaimer
This article should in no way be interpreted as advice. The article is based on the observed metrics at the time of writing, but you should always make your own analysis and trade or invest at your own responsibility.
32.74
-0.12 (-0.37%)
Find more stocks in the Stock Screener
WGO Latest News and Analysis
 a few seconds ago - ChartmillExploring WINNEBAGO INDUSTRIES (NYSE:WGO)'s dividend characteristics.
Why the dividend investor may take a look at WINNEBAGO INDUSTRIES (NYSE:WGO).
