Despite its impressive fundamentals,WINNEBAGO INDUSTRIES (NYSE:WGO) remains undervalued.
By Mill Chart
Last update: Mar 7, 2025
WINNEBAGO INDUSTRIES (NYSE:WGO) has caught the attention of our stock screener as a great value stock. NYSE:WGO excels in profitability, solvency, and liquidity, all while being very reasonably priced. Let's delve into the details.
Analyzing Valuation Metrics
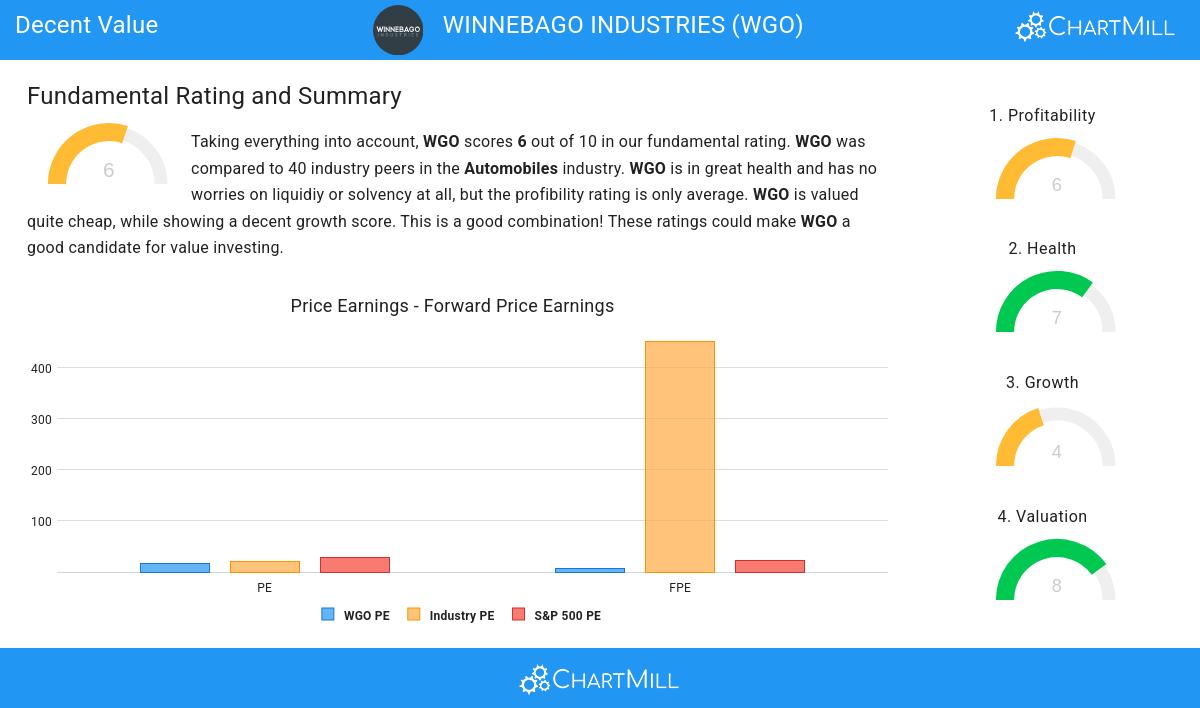
ChartMill assigns a Valuation Rating to each stock, ranging from 0 to 10. This rating is calculated by analyzing different valuation elements, such as price to earnings and free cash flow, both in absolute terms and relative to the market and industry. In the case of NYSE:WGO, the assigned 8 reflects its valuation:
- WGO's Price/Earnings ratio is rather cheap when compared to the industry. WGO is cheaper than 82.50% of the companies in the same industry.
- When comparing the Price/Earnings ratio of WGO to the average of the S&P500 Index (29.16), we can say WGO is valued slightly cheaper.
- WGO is valuated cheaply with a Price/Forward Earnings ratio of 7.77.
- WGO's Price/Forward Earnings ratio is rather cheap when compared to the industry. WGO is cheaper than 87.50% of the companies in the same industry.
- The average S&P500 Price/Forward Earnings ratio is at 21.95. WGO is valued rather cheaply when compared to this.
- Based on the Enterprise Value to EBITDA ratio, WGO is valued a bit cheaper than 80.00% of the companies in the same industry.
- Based on the Price/Free Cash Flow ratio, WGO is valued cheaply inside the industry as 92.50% of the companies are valued more expensively.
- The decent profitability rating of WGO may justify a higher PE ratio.
- A more expensive valuation may be justified as WGO's earnings are expected to grow with 33.67% in the coming years.
Profitability Examination for NYSE:WGO
ChartMill's Profitability Rating offers a unique perspective on stock analysis, providing scores from 0 to 10. These ratings consider a wide range of profitability metrics and margins, both in comparison to industry peers and on their own merits. For NYSE:WGO, the assigned 6 is a significant indicator of profitability:
- WGO's Return On Assets of -0.78% is fine compared to the rest of the industry. WGO outperforms 67.50% of its industry peers.
- WGO has a Return On Equity of -1.45%. This is in the better half of the industry: WGO outperforms 67.50% of its industry peers.
- Looking at the Return On Invested Capital, with a value of 3.67%, WGO is in the better half of the industry, outperforming 72.50% of the companies in the same industry.
- WGO had an Average Return On Invested Capital over the past 3 years of 13.73%. This is above the industry average of 9.08%.
- The 3 year average ROIC (13.73%) for WGO is well above the current ROIC(3.67%). The reason for the recent decline needs to be investigated.
- WGO's Operating Margin of 3.19% is fine compared to the rest of the industry. WGO outperforms 75.00% of its industry peers.
Evaluating Health: NYSE:WGO
ChartMill employs a unique Health Rating system for all stocks. This rating, ranging from 0 to 10, is determined by analyzing various liquidity and solvency ratios. For NYSE:WGO, the assigned 7 for health provides valuable insights:
- WGO has an Altman-Z score of 3.29. This indicates that WGO is financially healthy and has little risk of bankruptcy at the moment.
- WGO's Altman-Z score of 3.29 is amongst the best of the industry. WGO outperforms 87.50% of its industry peers.
- WGO has a Debt to FCF ratio of 6.61. This is amongst the best in the industry. WGO outperforms 90.00% of its industry peers.
- WGO has a Current Ratio of 2.58. This indicates that WGO is financially healthy and has no problem in meeting its short term obligations.
- WGO has a better Current ratio (2.58) than 82.50% of its industry peers.
- WGO's Quick ratio of 1.34 is fine compared to the rest of the industry. WGO outperforms 72.50% of its industry peers.
Analyzing Growth Metrics
ChartMill assigns a proprietary Growth Rating to each stock. The score is computed by evaluating various growth aspects, like EPS and revenue growth. We take into account the history as well as the estimated future numbers. NYSE:WGO was assigned a score of 4 for growth:
- The Revenue has been growing by 8.41% on average over the past years. This is quite good.
- The Earnings Per Share is expected to grow by 25.04% on average over the next years. This is a very strong growth
- When comparing the EPS growth rate of the last years to the growth rate of the upcoming years, we see that the growth is accelerating.
More Decent Value stocks can be found in our Decent Value screener.
Our latest full fundamental report of WGO contains the most current fundamental analsysis.
Disclaimer
This is not investing advice! The article highlights some of the observations at the time of writing, but you should always make your own analysis and invest based on your own insights.
37.7
+0.85 (+2.31%)
Find more stocks in the Stock Screener
WGO Latest News and Analysis
 2 days ago - ChartmillDespite its impressive fundamentals,WINNEBAGO INDUSTRIES (NYSE:WGO) remains undervalued.
WINNEBAGO INDUSTRIES has caught the attention as a great value stock. NYSE:WGO excels in profitability, solvency, and liquidity, all while being very reasonably priced.
