Technical Signals Point to a Possible Breakout for WEC ENERGY GROUP INC (NYSE:WEC).
By Mill Chart
Last update: Apr 18, 2025
WEC ENERGY GROUP INC (NYSE:WEC) was identified as a Technical Breakout Setup Pattern by our stockscreener. Such a pattern occurs when we see a pause in a strong uptrend: after a strong rise the stock is consolidating a bit and at some point the trend may be continued. Whether this actually happens can not be predicted of course, but it may be a good idea to keep and eye on NYSE:WEC.
Deciphering the Technical Picture of WEC
ChartMill assigns a Technical Rating to every stock. This score ranges from 0 to 10 and is updated daily. The score is determined by evaluating multiple technical indicators and properties.
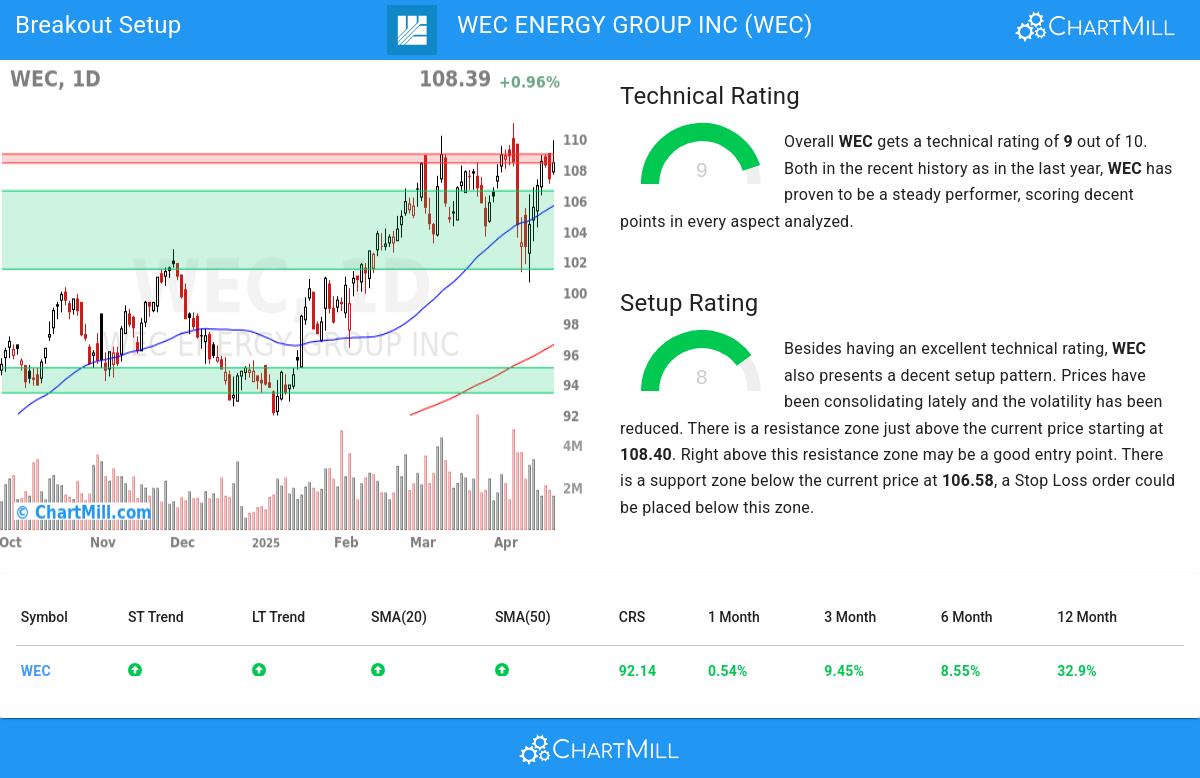
We assign a technical rating of 9 out of 10 to WEC. This is due to a consistent performance in both the short and longer term time frames. Also compared to the overall market, WEC is showing a nice and steady performance.
- Both the short term and long term trends are positive. This is a very positive sign.
- Looking at the yearly performance, WEC did better than 92% of all other stocks.
- WEC is part of the Multi-Utilities industry. There are 25 other stocks in this industry. WEC outperforms 91% of them.
- WEC is currently trading near its 52 week high. This is a good sign, certainly because the S&P500 Index is not trading near new highs.
- In the last month WEC has a been trading in the 100.64 - 111.00 range, which is quite wide. It is currently trading near the high of this range.
Check the latest full technical report of WEC for a complete technical analysis.
Looking at the Setup
In addition to the Technical Rating, ChartMill provides a Setup Rating for each stock. This rating, ranging from 0 to 10, assesses the extent of consolidation in the stock based on multiple short-term technical indicators. Currently, WEC has a 8 as its setup rating:
WEC has an excellent technical rating and also presents a decent setup pattern. We see reduced volatility while prices have been consolidating in the most recent period. There is a resistance zone just above the current price starting at 108.40. Right above this resistance zone may be a good entry point. There is a support zone below the current price at 106.58, a Stop Loss order could be placed below this zone.
Trading setups like WEC
For a potential trade one would typically wait until the stock breaks out of the consolidation zone to enter the stock and it could be sold again for a loss when it would fall back below the zone.
Please note that this article should not be construed as trading advice. The information provided is solely based on automated technical analysis and serves to highlight technical observations. It is important to conduct your own analysis and make trading decisions based on your own judgment and responsibility.
Our Breakout screener lists more breakout setups and is updated daily.
Disclaimer
This is not investing advice! The article highlights some of the observations at the time of writing, but you should always make your own analysis and invest based on your own insights.
108.39
+1.03 (+0.96%)
Find more stocks in the Stock Screener
WEC Latest News and Analysis
 3 minutes ago - ChartmillTechnical Signals Point to a Possible Breakout for WEC ENERGY GROUP INC (NYSE:WEC).
With a solid technical rating of 9 out of 10, WEC ENERGY GROUP INC (NYSE:WEC) is showing strong indications of a possible breakout.
