WEC ENERGY GROUP INC (NYSE:WEC) Technical Analysis observations.
By Mill Chart
Last update: Feb 13, 2025
WEC ENERGY GROUP INC (NYSE:WEC) was identified as a Technical Breakout Setup Pattern by our stockscreener. Such a pattern occurs when we see a pause in a strong uptrend: after a strong rise the stock is consolidating a bit and at some point the trend may be continued. Whether this actually happens can not be predicted of course, but it may be a good idea to keep and eye on NYSE:WEC.
Technical Analysis Observations
Every day ChartMill assigns a Technical Rating to every stock. The score ranges from 0 to 10 and is determined by evaluating multiple technical indicators and properties.
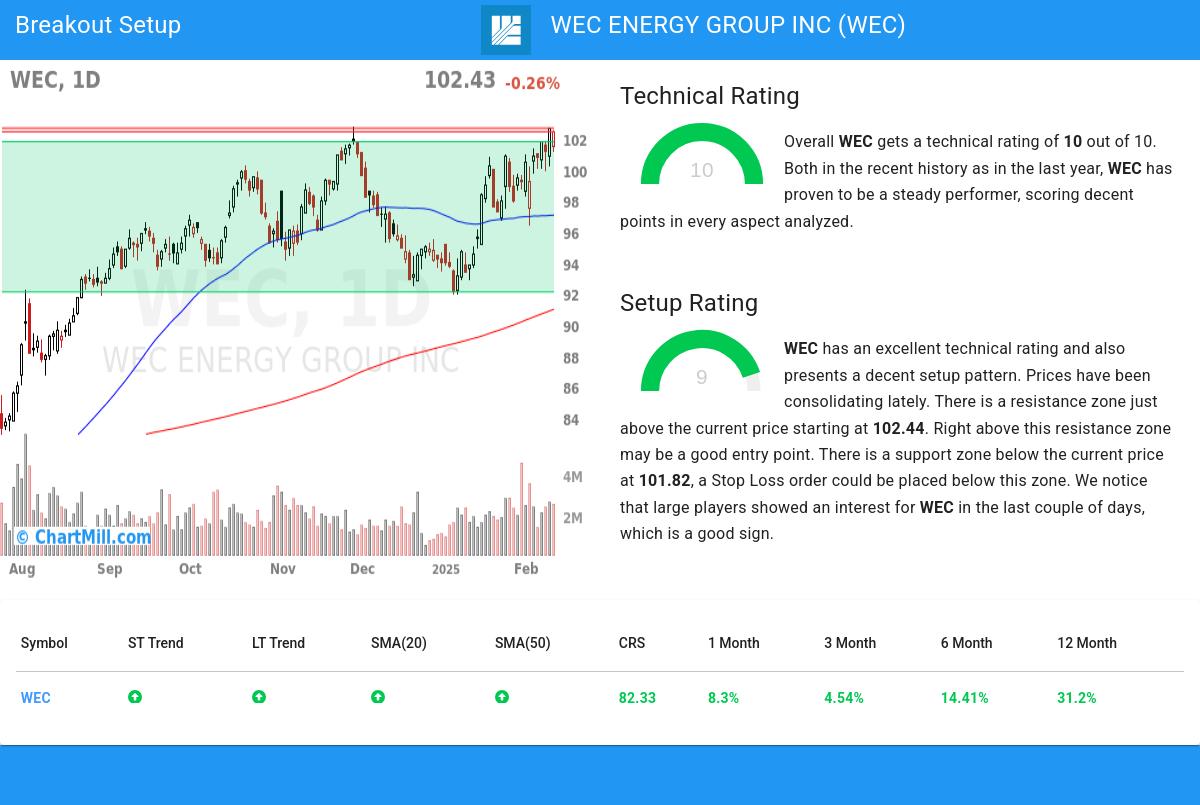
We assign a technical rating of 10 out of 10 to WEC. This is due to a consistent performance in both the short and longer term time frames. Also compared to the overall market, WEC is showing a nice and steady performance.
- The long and short term trends are both positive. This is looking good!
- Looking at the yearly performance, WEC did better than 82% of all other stocks. We also observe that the gains produced by WEC over the past year are nicely spread over this period.
- WEC is part of the Multi-Utilities industry. There are 25 other stocks in this industry. WEC outperforms 87% of them.
- WEC is currently trading near its 52 week high, which is a good sign. The S&P500 Index however is also trading near new highs, which makes the performance in line with the market.
- In the last month WEC has a been trading in the 94.93 - 102.74 range, which is quite wide. It is currently trading near the high of this range.
Check the latest full technical report of WEC for a complete technical analysis.
Looking at the Setup
Alongside the Technical Rating, ChartMill assigns a Setup Rating to evaluate the consolidation level of a stock. This rating, ranging from 0 to 10, is updated daily and considers various short-term technical indicators. The current setup rating for NYSE:WEC is 9:
WEC has an excellent technical rating and also presents a decent setup pattern. Prices have been consolidating lately. There is a resistance zone just above the current price starting at 102.44. Right above this resistance zone may be a good entry point. There is a support zone below the current price at 101.82, a Stop Loss order could be placed below this zone. We notice that large players showed an interest for WEC in the last couple of days, which is a good sign.
Trading breakout setups.
A breakout opportunity may arise when the stock surpasses the current consolidation zone and reaches new highs. Traders often wait for this breakout before considering buying the stock. To manage risk, a stop loss order could be placed below the consolidation zone to limit potential losses.
This article should in no way be interpreted as trading advice. You should always make your own analysis and trade or not trade based on your own observations and style. The article is based purely on some technical observations.
More breakout setups can be found in our Breakout screener.
Keep in mind
This article should in no way be interpreted as advice. The article is based on the observed metrics at the time of writing, but you should always make your own analysis and trade or invest at your own responsibility.
NYSE:WEC (2/19/2025, 2:53:55 PM)
103.21
+0.1 (+0.1%)
Find more stocks in the Stock Screener
WEC Latest News and Analysis
 6 days ago - ChartmillWEC ENERGY GROUP INC (NYSE:WEC) Technical Analysis observations.
Exploring WEC ENERGY GROUP INC's Technical Signals and Breakout Potential: There are signs that NYSE:WEC may be ready to breakout.
 13 days ago - ChartmillWondering what's happening in today's S&P500 pre-market session?
Let's have a look at what is happening on the US markets before the opening bell on Thursday. Below you can find the top S&P500 gainers and losers in today's pre-market session.
