WESCO INTERNATIONAL INC (NYSE:WCC), an undervalued stock with good fundamentals.
By Mill Chart
Last update: Apr 25, 2025
WESCO INTERNATIONAL INC (NYSE:WCC) was identified as a decent value stock by our stock screener. WCC scores well on profitability, solvency and liquidity. At the same time it seems to be priced very reasonably. We'll explore this a bit deeper below.
Looking at the Valuation
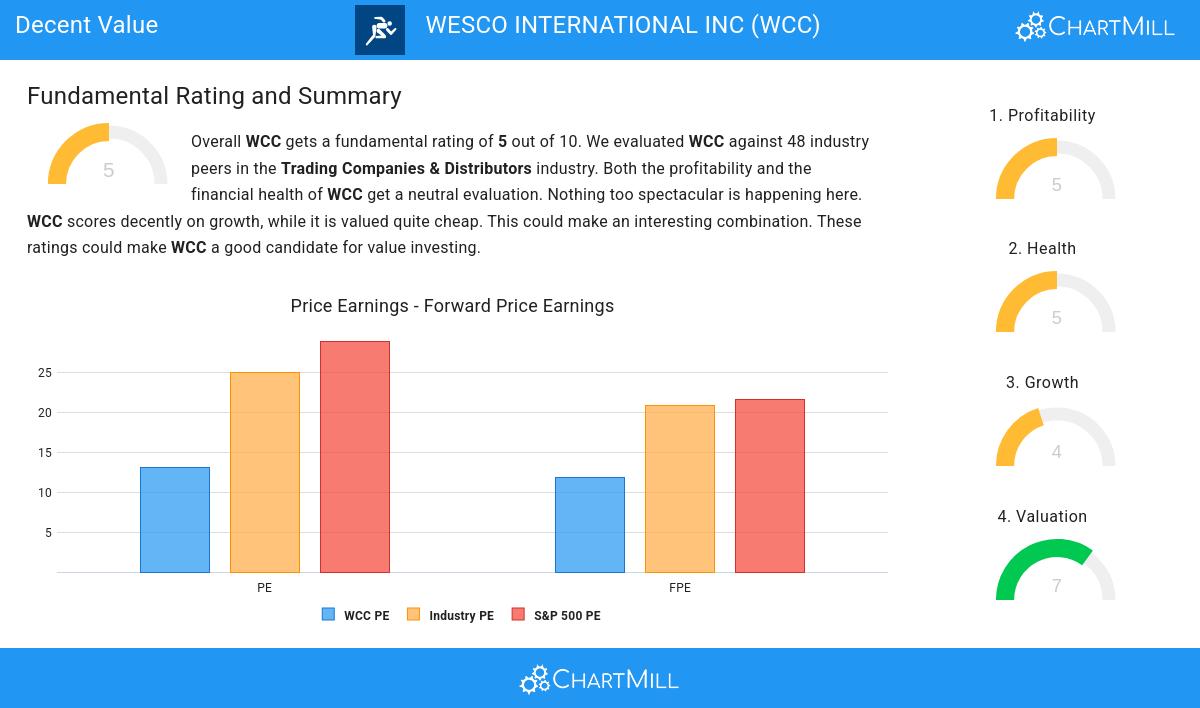
ChartMill assigns a Valuation Rating to every stock. This score ranges from 0 to 10 and evaluates the different valuation aspects and compares the price to earnings and cash flows, while taking into account profitability and growth. WCC scores a 7 out of 10:
- 81.25% of the companies in the same industry are more expensive than WCC, based on the Price/Earnings ratio.
- WCC's Price/Earnings ratio indicates a rather cheap valuation when compared to the S&P500 average which is at 28.92.
- A Price/Forward Earnings ratio of 11.80 indicates a reasonable valuation of WCC.
- WCC's Price/Forward Earnings ratio is rather cheap when compared to the industry. WCC is cheaper than 83.33% of the companies in the same industry.
- When comparing the Price/Forward Earnings ratio of WCC to the average of the S&P500 Index (21.65), we can say WCC is valued slightly cheaper.
- Based on the Enterprise Value to EBITDA ratio, WCC is valued a bit cheaper than the industry average as 68.75% of the companies are valued more expensively.
- WCC's Price/Free Cash Flow ratio is rather cheap when compared to the industry. WCC is cheaper than 93.75% of the companies in the same industry.
- WCC's earnings are expected to grow with 15.16% in the coming years. This may justify a more expensive valuation.
Profitability Analysis for WCC
ChartMill assigns a Profitability Rating to every stock. This score ranges from 0 to 10 and evaluates the different profitability ratios and margins, both absolutely, but also relative to the industry peers. WCC scores a 5 out of 10:
- The Return On Invested Capital of WCC (8.68%) is better than 62.50% of its industry peers.
- WCC's Profit Margin has improved in the last couple of years.
- WCC's Operating Margin has improved in the last couple of years.
- WCC's Gross Margin has improved in the last couple of years.
A Closer Look at Health for WCC
A critical element of ChartMill's stock evaluation is the Health Rating, which spans from 0 to 10. This rating considers multiple health factors, including liquidity and solvency, both in absolute terms and relative to industry peers. WCC has received a 5 out of 10:
- WCC has an Altman-Z score of 3.02. This indicates that WCC is financially healthy and has little risk of bankruptcy at the moment.
- WCC has a Debt to FCF ratio of 5.03. This is in the better half of the industry: WCC outperforms 62.50% of its industry peers.
- WCC has a Current Ratio of 2.20. This indicates that WCC is financially healthy and has no problem in meeting its short term obligations.
Assessing Growth Metrics for WCC
ChartMill assigns a Growth Rating to each stock, ranging from 0 to 10. This rating is determined by analyzing different growth elements, including EPS and revenue growth, spanning both historical and future figures. In the case of WCC, the assigned 4 reflects its growth potential:
- WCC shows quite a strong growth in Earnings Per Share. Measured over the last years, the EPS has been growing by 18.60% yearly.
- Measured over the past years, WCC shows a very strong growth in Revenue. The Revenue has been growing by 21.15% on average per year.
- Based on estimates for the next years, WCC will show a quite strong growth in Earnings Per Share. The EPS will grow by 8.23% on average per year.
Every day, new Decent Value stocks can be found on ChartMill in our Decent Value screener.
Our latest full fundamental report of WCC contains the most current fundamental analsysis.
Keep in mind
This article should in no way be interpreted as advice. The article is based on the observed metrics at the time of writing, but you should always make your own analysis and trade or invest at your own responsibility.
160.92
+6.73 (+4.36%)
Find more stocks in the Stock Screener
WCC Latest News and Analysis
 a few seconds ago - ChartmillWESCO INTERNATIONAL INC (NYSE:WCC), an undervalued stock with good fundamentals.
Uncover the potential of WESCO INTERNATIONAL INC, an undervalued stock. NYSE:WCC maintains a strong financial position and offers an appealing valuation.
