
Why the dividend investor may take a look at VALERO ENERGY CORP (NYSE:VLO).
By Mill Chart
Last update: Mar 4, 2025
Consider VALERO ENERGY CORP (NYSE:VLO) as a top pick for dividend investors, identified by our stock screening tool. NYSE:VLO shines in terms of profitability, solvency, and liquidity, all while paying a decent dividend. Let's dive deeper into the analysis.
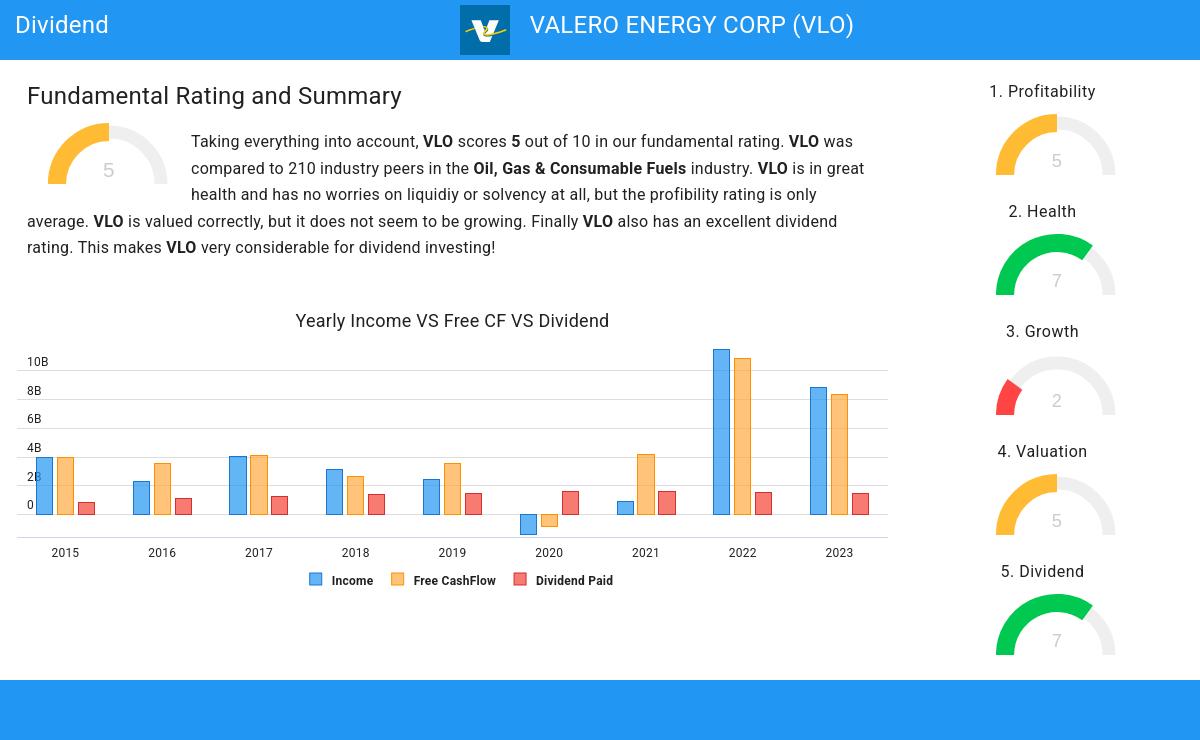
A Closer Look at Dividend for NYSE:VLO
ChartMill employs its own Dividend Rating system for all stocks. This score, on a scale of 0 to 10, is determined by evaluating different dividend factors, such as yield, historical performance, dividend growth, and sustainability. NYSE:VLO has been assigned a 7 for dividend:
- VLO's Dividend Yield is rather good when compared to the S&P500 average which is at 2.30.
- VLO has paid a dividend for at least 10 years, which is a reliable track record.
- VLO has not decreased its dividend for at least 10 years, so it has a reliable track record of non decreasing dividend.
- 37.79% of the earnings are spent on dividend by VLO. This is a low number and sustainable payout ratio.
- VLO's earnings are growing more than its dividend. This makes the dividend growth sustainable.
Assessing Health Metrics for NYSE:VLO
Every stock is evaluated by ChartMill, receiving a Health Rating on a scale of 0 to 10. This assessment considers different health aspects, including liquidity and solvency, both in absolute terms and relative to industry peers. NYSE:VLO has achieved a 7 out of 10:
- VLO has an Altman-Z score of 4.46. This indicates that VLO is financially healthy and has little risk of bankruptcy at the moment.
- Looking at the Altman-Z score, with a value of 4.46, VLO belongs to the top of the industry, outperforming 88.67% of the companies in the same industry.
- VLO has a debt to FCF ratio of 1.80. This is a very positive value and a sign of high solvency as it would only need 1.80 years to pay back of all of its debts.
- VLO has a Debt to FCF ratio of 1.80. This is amongst the best in the industry. VLO outperforms 81.28% of its industry peers.
- VLO has a Debt/Equity ratio of 0.39. This is a healthy value indicating a solid balance between debt and equity.
- The Current ratio of VLO (1.57) is better than 63.55% of its industry peers.
How do we evaluate the Profitability for NYSE:VLO?
ChartMill assigns a Profitability Rating to every stock. This score ranges from 0 to 10 and evaluates the different profitability ratios and margins, both absolutely, but also relative to the industry peers. NYSE:VLO scores a 5 out of 10:
- Looking at the Return On Equity, with a value of 14.58%, VLO is in the better half of the industry, outperforming 62.56% of the companies in the same industry.
- With a decent Return On Invested Capital value of 8.55%, VLO is doing good in the industry, outperforming 60.10% of the companies in the same industry.
- The last Return On Invested Capital (8.55%) for VLO is well below the 3 year average (17.35%), which needs to be investigated, but indicates that VLO had better years and this may not be a problem.
- VLO's Profit Margin has improved in the last couple of years.
- VLO's Operating Margin has improved in the last couple of years.
- VLO's Gross Margin has improved in the last couple of years.
More Best Dividend stocks can be found in our Best Dividend screener.
For an up to date full fundamental analysis you can check the fundamental report of VLO
Keep in mind
Important Note: The content of this article is not intended as trading advice. It is essential to perform your own analysis and exercise caution when making trading decisions. The article presents observations created by automated analysis but does not guarantee any trading or investment outcomes. Always trade responsibly and make independent judgments.
NYSE:VLO (4/24/2025, 12:50:07 PM)
113.2
-1.3 (-1.14%)
Find more stocks in the Stock Screener
