Investors should take note of NASDAQ:VITL, a growth stock that remains attractively priced.
By Mill Chart
Last update: Feb 11, 2025
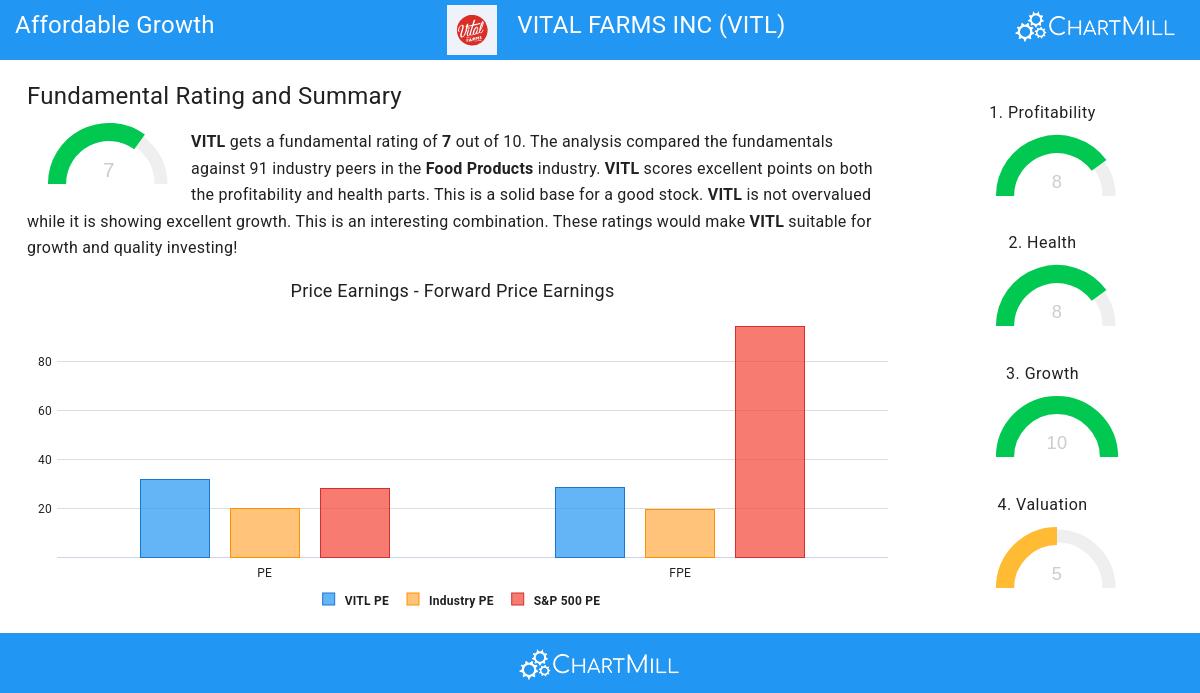
VITAL FARMS INC (NASDAQ:VITL) was identified as an affordable growth stock by our stock screener. NASDAQ:VITL is showing great growth, but also scores well on profitability, solvency and liquidity. At the same time it seems to be priced reasonably. We'll explore this a bit deeper below.
What does the Growth looks like for NASDAQ:VITL
To evaluate a stock's growth potential, ChartMill utilizes a Growth Rating on a scale of 0 to 10. This comprehensive assessment considers various growth aspects, including historical and estimated EPS and revenue growth. NASDAQ:VITL has achieved a 10 out of 10:
- VITL shows a strong growth in Earnings Per Share. In the last year, the EPS has been growing by 148.89%, which is quite impressive.
- The Earnings Per Share has been growing by 31.52% on average over the past years. This is a very strong growth
- Looking at the last year, VITL shows a very strong growth in Revenue. The Revenue has grown by 29.15%.
- VITL shows a strong growth in Revenue. Measured over the last years, the Revenue has been growing by 34.63% yearly.
- VITL is expected to show a strong growth in Earnings Per Share. In the coming years, the EPS will grow by 38.48% yearly.
- Based on estimates for the next years, VITL will show a very strong growth in Revenue. The Revenue will grow by 22.02% on average per year.
- The EPS growth rate is accelerating: in the next years the growth will be better than in the last years.
Assessing Valuation Metrics for NASDAQ:VITL
ChartMill provides a Valuation Rating to every stock, ranging from 0 to 10. This rating assesses various valuation aspects, comparing price to earnings and cash flows, while considering factors like profitability and growth. NASDAQ:VITL boasts a 5 out of 10:
- VITL is valuated cheaply when we compare the Price/Forward Earnings ratio to 94.48, which is the current average of the S&P500 Index.
- VITL's low PEG Ratio(NY), which compensates the Price/Earnings for growth, indicates a rather cheap valuation of the company.
- The excellent profitability rating of VITL may justify a higher PE ratio.
- VITL's earnings are expected to grow with 38.48% in the coming years. This may justify a more expensive valuation.
Health Analysis for NASDAQ:VITL
ChartMill employs a unique Health Rating system for all stocks. This rating, ranging from 0 to 10, is determined by analyzing various liquidity and solvency ratios. For NASDAQ:VITL, the assigned 8 for health provides valuable insights:
- An Altman-Z score of 13.33 indicates that VITL is not in any danger for bankruptcy at the moment.
- VITL's Altman-Z score of 13.33 is amongst the best of the industry. VITL outperforms 97.67% of its industry peers.
- The Debt to FCF ratio of VITL is 0.21, which is an excellent value as it means it would take VITL, only 0.21 years of fcf income to pay off all of its debts.
- Looking at the Debt to FCF ratio, with a value of 0.21, VITL belongs to the top of the industry, outperforming 91.86% of the companies in the same industry.
- A Debt/Equity ratio of 0.04 indicates that VITL is not too dependend on debt financing.
- VITL has a Debt to Equity ratio of 0.04. This is amongst the best in the industry. VITL outperforms 80.23% of its industry peers.
- VITL has a Current Ratio of 3.24. This indicates that VITL is financially healthy and has no problem in meeting its short term obligations.
- VITL has a Current ratio of 3.24. This is amongst the best in the industry. VITL outperforms 83.72% of its industry peers.
- A Quick Ratio of 2.81 indicates that VITL has no problem at all paying its short term obligations.
- VITL has a better Quick ratio (2.81) than 90.70% of its industry peers.
Profitability Examination for NASDAQ:VITL
ChartMill's Profitability Rating offers a unique perspective on stock analysis, providing scores from 0 to 10. These ratings consider a wide range of profitability metrics and margins, both in comparison to industry peers and on their own merits. For NASDAQ:VITL, the assigned 8 is a significant indicator of profitability:
- VITL has a better Return On Assets (14.51%) than 95.35% of its industry peers.
- VITL has a better Return On Equity (19.74%) than 88.37% of its industry peers.
- VITL has a better Return On Invested Capital (13.66%) than 89.53% of its industry peers.
- The last Return On Invested Capital (13.66%) for VITL is above the 3 year average (3.76%), which is a sign of increasing profitability.
- VITL has a Profit Margin of 8.68%. This is amongst the best in the industry. VITL outperforms 81.40% of its industry peers.
- VITL's Operating Margin of 10.35% is fine compared to the rest of the industry. VITL outperforms 73.26% of its industry peers.
- In the last couple of years the Operating Margin of VITL has grown nicely.
- VITL has a better Gross Margin (37.36%) than 82.56% of its industry peers.
More Affordable Growth stocks can be found in our Affordable Growth screener.
For an up to date full fundamental analysis you can check the fundamental report of VITL
Keep in mind
This is not investing advice! The article highlights some of the observations at the time of writing, but you should always make your own analysis and invest based on your own insights.
NASDAQ:VITL (2/19/2025, 3:16:02 PM)
35.1394
+0.83 (+2.42%)
Find more stocks in the Stock Screener
VITL Latest News and Analysis
 8 days ago - ChartmillInvestors should take note of NASDAQ:VITL, a growth stock that remains attractively priced.
VITAL FARMS INC was identified as an affordable growth stock. NASDAQ:VITL is showing great growth, but also scores well on profitability. At the same time it seems to be priced reasonably.
 16 days ago - ChartmillIs NASDAQ:VITL suited for growth investing?
A fundamental analysis of (NASDAQ:VITL): Is VITAL FARMS INC (NASDAQ:VITL) a Fit for Growth Investing Strategies?
 19 days ago - ChartmillWhy NASDAQ:VITL Is a Promising High-Growth Stock in the Midst of Consolidation.
Based on a technical and fundamental analysis of NASDAQ:VITL we can say: VITAL FARMS INC (NASDAQ:VITL), a strong growth stock, setting up for a breakout.
