NASDAQ:VITL: a strong growth stock preparing for the next leg up?.
By Mill Chart
Last update: Sep 11, 2024
For growth-minded investors, high revenue and EPS growth are key criteria. Today, we'll examine whether VITAL FARMS INC (NASDAQ:VITL) fits the bill for growth investing, particularly as it forms a base and hints at a potential breakout. Remember, due diligence is essential, but VITAL FARMS INC has caught our attention on our screen for growth with base formation. It may warrant additional investigation.
Understanding NASDAQ:VITL's Growth
ChartMill assigns a Growth Rating to every stock. This score ranges from 0 to 10 and evaluates the different growth aspects like EPS and Revenue, both in the past as in the future. NASDAQ:VITL scores a 10 out of 10:
- The Earnings Per Share has grown by an impressive 186.49% over the past year.
- The Earnings Per Share has been growing by 31.52% on average over the past years. This is a very strong growth
- VITL shows a strong growth in Revenue. In the last year, the Revenue has grown by 26.61%.
- The Revenue has been growing by 34.63% on average over the past years. This is a very strong growth!
- Based on estimates for the next years, VITL will show a very strong growth in Earnings Per Share. The EPS will grow by 42.00% on average per year.
- The Revenue is expected to grow by 22.09% on average over the next years. This is a very strong growth
- The EPS growth rate is accelerating: in the next years the growth will be better than in the last years.
What does the Health looks like for NASDAQ:VITL
Every stock is evaluated by ChartMill, receiving a Health Rating on a scale of 0 to 10. This assessment considers different health aspects, including liquidity and solvency, both in absolute terms and relative to industry peers. NASDAQ:VITL has achieved a 8 out of 10:
- An Altman-Z score of 12.97 indicates that VITL is not in any danger for bankruptcy at the moment.
- VITL has a better Altman-Z score (12.97) than 96.70% of its industry peers.
- The Debt to FCF ratio of VITL is 0.23, which is an excellent value as it means it would take VITL, only 0.23 years of fcf income to pay off all of its debts.
- VITL's Debt to FCF ratio of 0.23 is amongst the best of the industry. VITL outperforms 94.51% of its industry peers.
- A Debt/Equity ratio of 0.04 indicates that VITL is not too dependend on debt financing.
- The Debt to Equity ratio of VITL (0.04) is better than 81.32% of its industry peers.
- VITL has a Current Ratio of 3.50. This indicates that VITL is financially healthy and has no problem in meeting its short term obligations.
- VITL's Current ratio of 3.50 is amongst the best of the industry. VITL outperforms 87.91% of its industry peers.
- VITL has a Quick Ratio of 3.03. This indicates that VITL is financially healthy and has no problem in meeting its short term obligations.
- With an excellent Quick ratio value of 3.03, VITL belongs to the best of the industry, outperforming 92.31% of the companies in the same industry.
Evaluating Profitability: NASDAQ:VITL
Discover ChartMill's exclusive Profitability Rating, a proprietary metric that assesses stocks on a scale of 0 to 10. It takes into consideration various profitability ratios and margins, both in absolute terms and relative to industry peers. Notably, NASDAQ:VITL has achieved a 8:
- Looking at the Return On Assets, with a value of 14.69%, VITL belongs to the top of the industry, outperforming 94.51% of the companies in the same industry.
- VITL's Return On Equity of 19.74% is amongst the best of the industry. VITL outperforms 87.91% of its industry peers.
- The Return On Invested Capital of VITL (13.41%) is better than 92.31% of its industry peers.
- The 3 year average ROIC (3.76%) for VITL is below the current ROIC(13.41%), indicating increased profibility in the last year.
- With an excellent Profit Margin value of 8.69%, VITL belongs to the best of the industry, outperforming 81.32% of the companies in the same industry.
- VITL has a better Operating Margin (10.27%) than 75.82% of its industry peers.
- VITL's Operating Margin has improved in the last couple of years.
- With an excellent Gross Margin value of 36.65%, VITL belongs to the best of the industry, outperforming 85.71% of the companies in the same industry.
Looking at the Setup
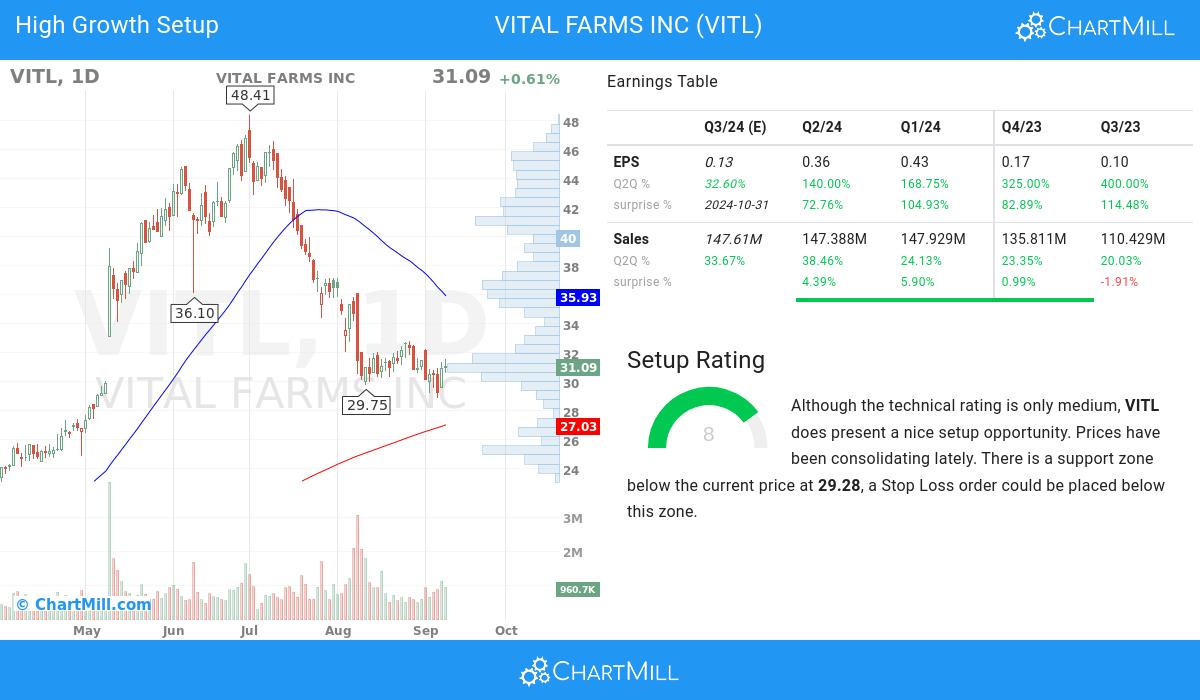
Besides the Technical Rating, ChartMill assigns a Setup Rating to every stock to determine the degree of consolidation. This rating, ranging from 0 to 10, is updated daily and evaluates various short-term technical indicators. NASDAQ:VITL currently holds a 8 as its setup rating, suggesting a particular level of consolidation in the stock.
Although the technical rating is only medium, VITL does present a nice setup opportunity. Prices have been consolidating lately. There is a support zone below the current price at 29.28, a Stop Loss order could be placed below this zone.
Every day, new Strong Growth stocks can be found on ChartMill in our Strong Growth screener.
For an up to date full fundamental analysis you can check the fundamental report of VITL
Check the latest full technical report of VITL for a complete technical analysis.
Keep in mind
Important Note: The content of this article is not intended as trading advice. It is essential to perform your own analysis and exercise caution when making trading decisions. The article presents observations created by automated analysis but does not guarantee any trading or investment outcomes. Always trade responsibly and make independent judgments.
35.38
+1.07 (+3.12%)
Find more stocks in the Stock Screener
VITL Latest News and Analysis
 9 days ago - ChartmillInvestors should take note of NASDAQ:VITL, a growth stock that remains attractively priced.
VITAL FARMS INC was identified as an affordable growth stock. NASDAQ:VITL is showing great growth, but also scores well on profitability. At the same time it seems to be priced reasonably.
 16 days ago - ChartmillIs NASDAQ:VITL suited for growth investing?
A fundamental analysis of (NASDAQ:VITL): Is VITAL FARMS INC (NASDAQ:VITL) a Fit for Growth Investing Strategies?
 19 days ago - ChartmillWhy NASDAQ:VITL Is a Promising High-Growth Stock in the Midst of Consolidation.
Based on a technical and fundamental analysis of NASDAQ:VITL we can say: VITAL FARMS INC (NASDAQ:VITL), a strong growth stock, setting up for a breakout.
