NYSE:VEEV is showing good growth, while it is not too expensive.
By Mill Chart
Last update: Feb 3, 2025
Here's VEEVA SYSTEMS INC-CLASS A (NYSE:VEEV) for you, a growth stock our stock screener believes is undervalued. NYSE:VEEV is scoring impressively in terms of growth while demonstrating strong financials. On top of that, it remains attractively priced. Let's break it down further.
Understanding NYSE:VEEV's Growth Score
ChartMill assigns a proprietary Growth Rating to each stock. The score is computed by evaluating various growth aspects, like EPS and revenue growth. We take into account the history as well as the estimated future numbers. NYSE:VEEV was assigned a score of 8 for growth:
- The Earnings Per Share has grown by an impressive 35.57% over the past year.
- The Earnings Per Share has been growing by 24.47% on average over the past years. This is a very strong growth
- VEEV shows quite a strong growth in Revenue. In the last year, the Revenue has grown by 15.67%.
- VEEV shows a strong growth in Revenue. Measured over the last years, the Revenue has been growing by 22.35% yearly.
- The Earnings Per Share is expected to grow by 16.21% on average over the next years. This is quite good.
- Based on estimates for the next years, VEEV will show a quite strong growth in Revenue. The Revenue will grow by 13.25% on average per year.
Exploring NYSE:VEEV's Valuation
To assess a stock's valuation, ChartMill utilizes a Valuation Rating on a scale of 0 to 10. This comprehensive assessment considers various valuation aspects, comparing price to earnings and cash flows, while factoring in profitability and growth. NYSE:VEEV has achieved a 6 out of 10:
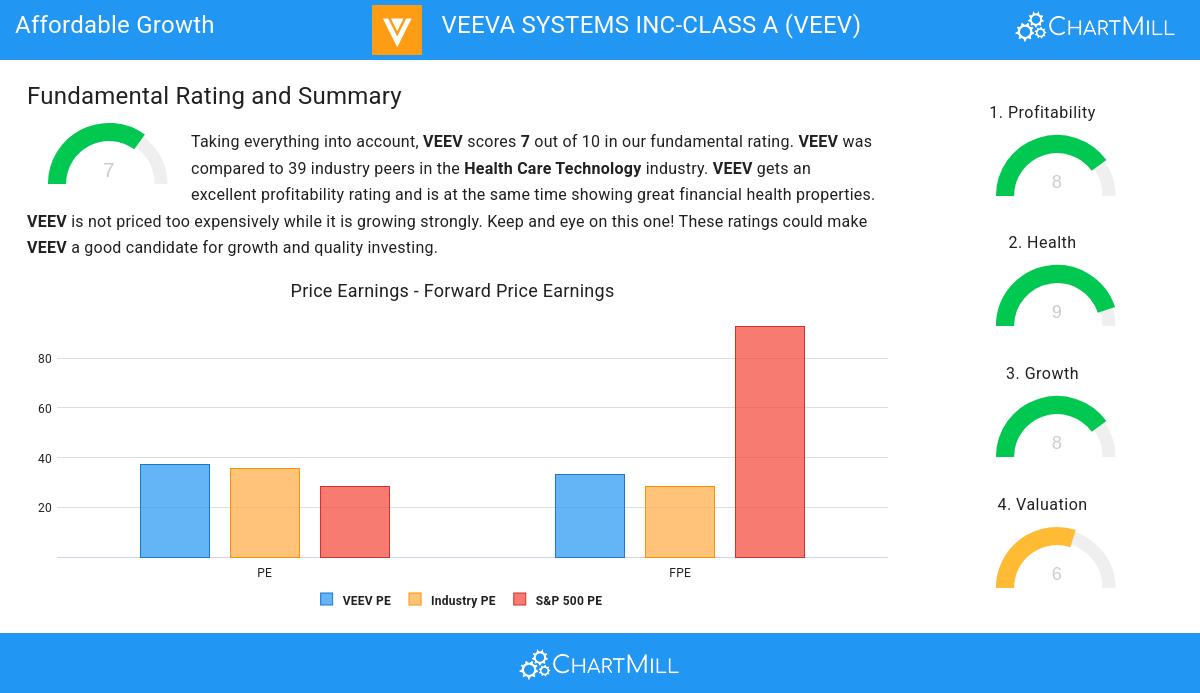
- 83.78% of the companies in the same industry are more expensive than VEEV, based on the Price/Earnings ratio.
- Based on the Price/Forward Earnings ratio, VEEV is valued cheaply inside the industry as 81.08% of the companies are valued more expensively.
- The average S&P500 Price/Forward Earnings ratio is at 92.87. VEEV is valued rather cheaply when compared to this.
- Compared to the rest of the industry, the Enterprise Value to EBITDA ratio of VEEV indicates a somewhat cheap valuation: VEEV is cheaper than 70.27% of the companies listed in the same industry.
- 67.57% of the companies in the same industry are more expensive than VEEV, based on the Price/Free Cash Flow ratio.
- The excellent profitability rating of VEEV may justify a higher PE ratio.
- VEEV's earnings are expected to grow with 17.47% in the coming years. This may justify a more expensive valuation.
Health Assessment of NYSE:VEEV
ChartMill assigns a Health Rating to every stock. This score ranges from 0 to 10 and evaluates the different health aspects like liquidity and solvency, both absolutely, but also relative to the industry peers. NYSE:VEEV scores a 9 out of 10:
- An Altman-Z score of 26.18 indicates that VEEV is not in any danger for bankruptcy at the moment.
- VEEV's Altman-Z score of 26.18 is amongst the best of the industry. VEEV outperforms 94.59% of its industry peers.
- There is no outstanding debt for VEEV. This means it has a Debt/Equity and Debt/FCF ratio of 0 and it is amongst the best of the sector and industry.
- VEEV has a Current Ratio of 6.36. This indicates that VEEV is financially healthy and has no problem in meeting its short term obligations.
- Looking at the Current ratio, with a value of 6.36, VEEV belongs to the top of the industry, outperforming 97.30% of the companies in the same industry.
- A Quick Ratio of 6.36 indicates that VEEV has no problem at all paying its short term obligations.
- With an excellent Quick ratio value of 6.36, VEEV belongs to the best of the industry, outperforming 97.30% of the companies in the same industry.
A Closer Look at Profitability for NYSE:VEEV
ChartMill utilizes a Profitability Rating to assess stocks, scoring them on a scale of 0 to 10. This rating takes into account a variety of profitability ratios and margins, both in absolute terms and in comparison to industry peers. NYSE:VEEV has earned a 8 out of 10:
- VEEV has a Return On Assets of 10.32%. This is amongst the best in the industry. VEEV outperforms 94.59% of its industry peers.
- The Return On Equity of VEEV (12.10%) is better than 94.59% of its industry peers.
- The Return On Invested Capital of VEEV (9.08%) is better than 97.30% of its industry peers.
- The Average Return On Invested Capital over the past 3 years for VEEV is above the industry average of 6.36%.
- Looking at the Profit Margin, with a value of 25.07%, VEEV belongs to the top of the industry, outperforming 94.59% of the companies in the same industry.
- Looking at the Operating Margin, with a value of 24.22%, VEEV belongs to the top of the industry, outperforming 97.30% of the companies in the same industry.
- With an excellent Gross Margin value of 73.93%, VEEV belongs to the best of the industry, outperforming 81.08% of the companies in the same industry.
More Affordable Growth stocks can be found in our Affordable Growth screener.
Our latest full fundamental report of VEEV contains the most current fundamental analsysis.
Keep in mind
This is not investing advice! The article highlights some of the observations at the time of writing, but you should always make your own analysis and invest based on your own insights.
NYSE:VEEV (3/5/2025, 10:11:05 AM)
216.375
-2.07 (-0.95%)
Find more stocks in the Stock Screener
VEEV Latest News and Analysis
 8 days ago - ChartmillInvestors seeking growth at a reasonable cost should explore NYSE:VEEV.
NYSE:VEEV is scoring great on several growth aspects while it also shows decent health and profitability. At the same time it remains remains attractively priced.
