
Investors seeking growth at a reasonable cost should explore NYSE:VEEV.
By Mill Chart
Last update: Feb 25, 2025
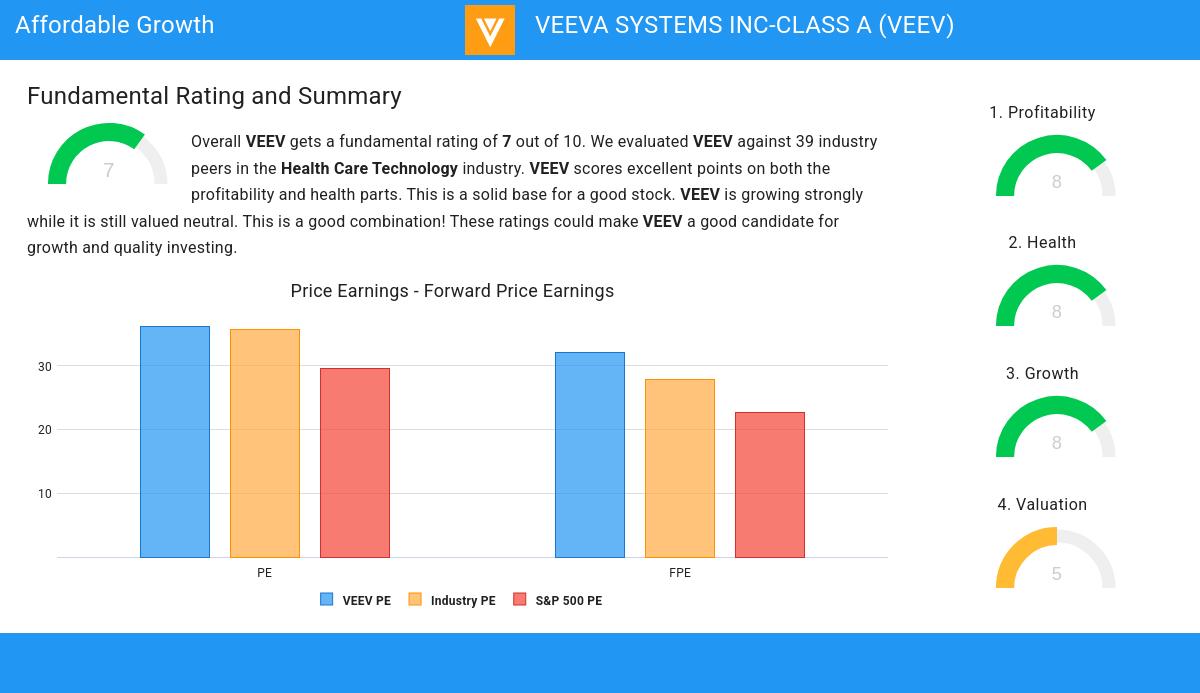
Consider VEEVA SYSTEMS INC-CLASS A (NYSE:VEEV) as an affordable growth stock, identified by our stock screening tool. NYSE:VEEV is showcasing impressive growth figures and is well-positioned in terms of profitability, solvency, and liquidity. Moreover, it seems to be priced reasonably. Let's dive deeper into the analysis.
How We Gauge Growth for NYSE:VEEV
ChartMill assigns a proprietary Growth Rating to each stock. The score is computed by evaluating various growth aspects, like EPS and revenue growth. We take into account the history as well as the estimated future numbers. NYSE:VEEV was assigned a score of 8 for growth:
- VEEV shows a strong growth in Earnings Per Share. In the last year, the EPS has been growing by 35.57%, which is quite impressive.
- Measured over the past years, VEEV shows a very strong growth in Earnings Per Share. The EPS has been growing by 24.47% on average per year.
- Looking at the last year, VEEV shows a quite strong growth in Revenue. The Revenue has grown by 15.67% in the last year.
- Measured over the past years, VEEV shows a very strong growth in Revenue. The Revenue has been growing by 22.35% on average per year.
- The Earnings Per Share is expected to grow by 16.21% on average over the next years. This is quite good.
- Based on estimates for the next years, VEEV will show a quite strong growth in Revenue. The Revenue will grow by 13.25% on average per year.
ChartMill's Evaluation of Valuation
ChartMill assigns a Valuation Rating to every stock. This score ranges from 0 to 10 and evaluates the different valuation aspects and compares the price to earnings and cash flows, while taking into account profitability and growth. NYSE:VEEV scores a 5 out of 10:
- VEEV's Price/Earnings ratio is rather cheap when compared to the industry. VEEV is cheaper than 83.78% of the companies in the same industry.
- 81.08% of the companies in the same industry are more expensive than VEEV, based on the Price/Forward Earnings ratio.
- Based on the Enterprise Value to EBITDA ratio, VEEV is valued a bit cheaper than 70.27% of the companies in the same industry.
- Compared to the rest of the industry, the Price/Free Cash Flow ratio of VEEV indicates a somewhat cheap valuation: VEEV is cheaper than 67.57% of the companies listed in the same industry.
- The excellent profitability rating of VEEV may justify a higher PE ratio.
- A more expensive valuation may be justified as VEEV's earnings are expected to grow with 17.47% in the coming years.
Health Analysis for NYSE:VEEV
To gauge a stock's financial health, ChartMill utilizes a Health Rating on a scale of 0 to 10. This comprehensive evaluation encompasses liquidity and solvency, both in absolute terms and in comparison to industry peers. NYSE:VEEV has earned a 8 out of 10:
- An Altman-Z score of 25.45 indicates that VEEV is not in any danger for bankruptcy at the moment.
- VEEV has a Altman-Z score of 25.45. This is amongst the best in the industry. VEEV outperforms 94.59% of its industry peers.
- VEEV has no outstanding debt. Therefor its Debt/Equity and Debt/FCF ratios are 0 and belong to the best of the industry.
- A Current Ratio of 6.36 indicates that VEEV has no problem at all paying its short term obligations.
- Looking at the Current ratio, with a value of 6.36, VEEV belongs to the top of the industry, outperforming 97.30% of the companies in the same industry.
- A Quick Ratio of 6.36 indicates that VEEV has no problem at all paying its short term obligations.
- Looking at the Quick ratio, with a value of 6.36, VEEV belongs to the top of the industry, outperforming 97.30% of the companies in the same industry.
Exploring NYSE:VEEV's Profitability
ChartMill assigns a Profitability Rating to every stock. This score ranges from 0 to 10 and evaluates the different profitability ratios and margins, both absolutely, but also relative to the industry peers. NYSE:VEEV scores a 8 out of 10:
- VEEV has a Return On Assets of 10.32%. This is amongst the best in the industry. VEEV outperforms 94.59% of its industry peers.
- Looking at the Return On Equity, with a value of 12.10%, VEEV belongs to the top of the industry, outperforming 94.59% of the companies in the same industry.
- The Return On Invested Capital of VEEV (9.08%) is better than 97.30% of its industry peers.
- The Average Return On Invested Capital over the past 3 years for VEEV is above the industry average of 6.44%.
- VEEV has a better Profit Margin (25.07%) than 94.59% of its industry peers.
- With an excellent Operating Margin value of 24.22%, VEEV belongs to the best of the industry, outperforming 97.30% of the companies in the same industry.
- VEEV has a better Gross Margin (73.93%) than 81.08% of its industry peers.
Our Affordable Growth screener lists more Affordable Growth stocks and is updated daily.
Our latest full fundamental report of VEEV contains the most current fundamental analsysis.
Keep in mind
Important Note: The content of this article is not intended as trading advice. It is essential to perform your own analysis and exercise caution when making trading decisions. The article presents observations created by automated analysis but does not guarantee any trading or investment outcomes. Always trade responsibly and make independent judgments.
NYSE:VEEV (4/17/2025, 2:59:09 PM)
217.02
-3.64 (-1.65%)
Find more stocks in the Stock Screener
