
Despite its impressive fundamentals, NASDAQ:URBN remains undervalued.
By Mill Chart
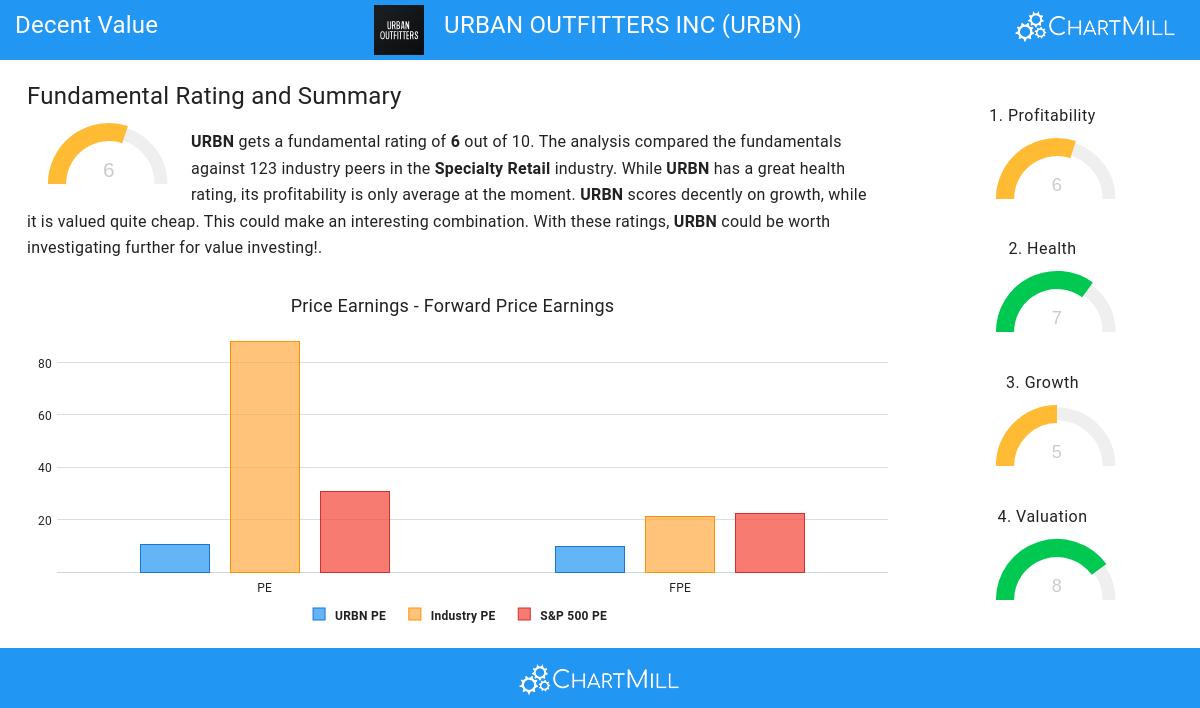
Last update: Sep 20, 2024
Our stock screener has spotted URBAN OUTFITTERS INC (NASDAQ:URBN) as an undervalued stock with solid fundamentals. NASDAQ:URBN shows decent health and profitability. At the same time it remains remains attractively priced. We'll dive into each aspect below.
Valuation Assessment of NASDAQ:URBN
ChartMill employs its own Valuation Rating system for all stocks. This score, ranging from 0 to 10, is determined by evaluating different valuation factors, including price to earnings and free cash flow, both in absolute terms and relative to the market and industry. NASDAQ:URBN has earned a 8 for valuation:
- With a Price/Earnings ratio of 10.69, the valuation of URBN can be described as very reasonable.
- 85.25% of the companies in the same industry are more expensive than URBN, based on the Price/Earnings ratio.
- The average S&P500 Price/Earnings ratio is at 30.79. URBN is valued rather cheaply when compared to this.
- The Price/Forward Earnings ratio is 9.56, which indicates a very decent valuation of URBN.
- Based on the Price/Forward Earnings ratio, URBN is valued cheaper than 82.79% of the companies in the same industry.
- When comparing the Price/Forward Earnings ratio of URBN to the average of the S&P500 Index (22.21), we can say URBN is valued rather cheaply.
- URBN's Enterprise Value to EBITDA ratio is rather cheap when compared to the industry. URBN is cheaper than 94.26% of the companies in the same industry.
- 74.59% of the companies in the same industry are more expensive than URBN, based on the Price/Free Cash Flow ratio.
- The low PEG Ratio(NY), which compensates the Price/Earnings for growth, indicates a rather cheap valuation of the company.
- URBN has a very decent profitability rating, which may justify a higher PE ratio.
What does the Profitability looks like for NASDAQ:URBN
ChartMill utilizes a Profitability Rating to assess stocks, scoring them on a scale of 0 to 10. This rating takes into account a variety of profitability ratios and margins, both in absolute terms and in comparison to industry peers. NASDAQ:URBN has earned a 6 out of 10:
- With a decent Return On Assets value of 7.28%, URBN is doing good in the industry, outperforming 77.87% of the companies in the same industry.
- URBN has a Return On Equity of 13.83%. This is in the better half of the industry: URBN outperforms 72.13% of its industry peers.
- URBN's Return On Invested Capital of 9.29% is fine compared to the rest of the industry. URBN outperforms 72.95% of its industry peers.
- The 3 year average ROIC (8.69%) for URBN is below the current ROIC(9.29%), indicating increased profibility in the last year.
- URBN's Profit Margin of 5.83% is fine compared to the rest of the industry. URBN outperforms 78.69% of its industry peers.
- Looking at the Operating Margin, with a value of 7.69%, URBN is in the better half of the industry, outperforming 77.87% of the companies in the same industry.
Unpacking NASDAQ:URBN's Health Rating
Every stock is evaluated by ChartMill, receiving a Health Rating on a scale of 0 to 10. This assessment considers different health aspects, including liquidity and solvency, both in absolute terms and relative to industry peers. NASDAQ:URBN has achieved a 7 out of 10:
- URBN has an Altman-Z score of 3.48. This indicates that URBN is financially healthy and has little risk of bankruptcy at the moment.
- URBN has a Altman-Z score of 3.48. This is in the better half of the industry: URBN outperforms 77.05% of its industry peers.
- There is no outstanding debt for URBN. This means it has a Debt/Equity and Debt/FCF ratio of 0 and it is amongst the best of the sector and industry.
- With a decent Quick ratio value of 0.86, URBN is doing good in the industry, outperforming 69.67% of the companies in the same industry.
ChartMill's Evaluation of Growth
ChartMill assigns a Growth Rating to each stock, ranging from 0 to 10. This rating is determined by analyzing different growth elements, including EPS and revenue growth, spanning both historical and future figures. In the case of NASDAQ:URBN, the assigned 5 reflects its growth potential:
- URBN shows a strong growth in Earnings Per Share. In the last year, the EPS has been growing by 46.25%, which is quite impressive.
- URBN is expected to show quite a strong growth in Earnings Per Share. In the coming years, the EPS will grow by 8.83% yearly.
- When comparing the EPS growth rate of the last years to the growth rate of the upcoming years, we see that the growth is accelerating.
More Decent Value stocks can be found in our Decent Value screener.
Check the latest full fundamental report of URBN for a complete fundamental analysis.
Disclaimer
This article should in no way be interpreted as advice. The article is based on the observed metrics at the time of writing, but you should always make your own analysis and trade or invest at your own responsibility.
NASDAQ:URBN (2/19/2025, 3:31:47 PM)
55.5
-1.9 (-3.31%)
Find more stocks in the Stock Screener
