
NYSE:UPS stands out as a stock that provides good value for the fundamentals it showcases.
By Mill Chart
Last update: Feb 3, 2025
Our stock screening tool has identified UNITED PARCEL SERVICE-CL B (NYSE:UPS) as an undervalued gem with strong fundamentals. NYSE:UPS boasts decent financial health and profitability while maintaining an attractive price point. We'll break it down further.
A Closer Look at Valuation for NYSE:UPS
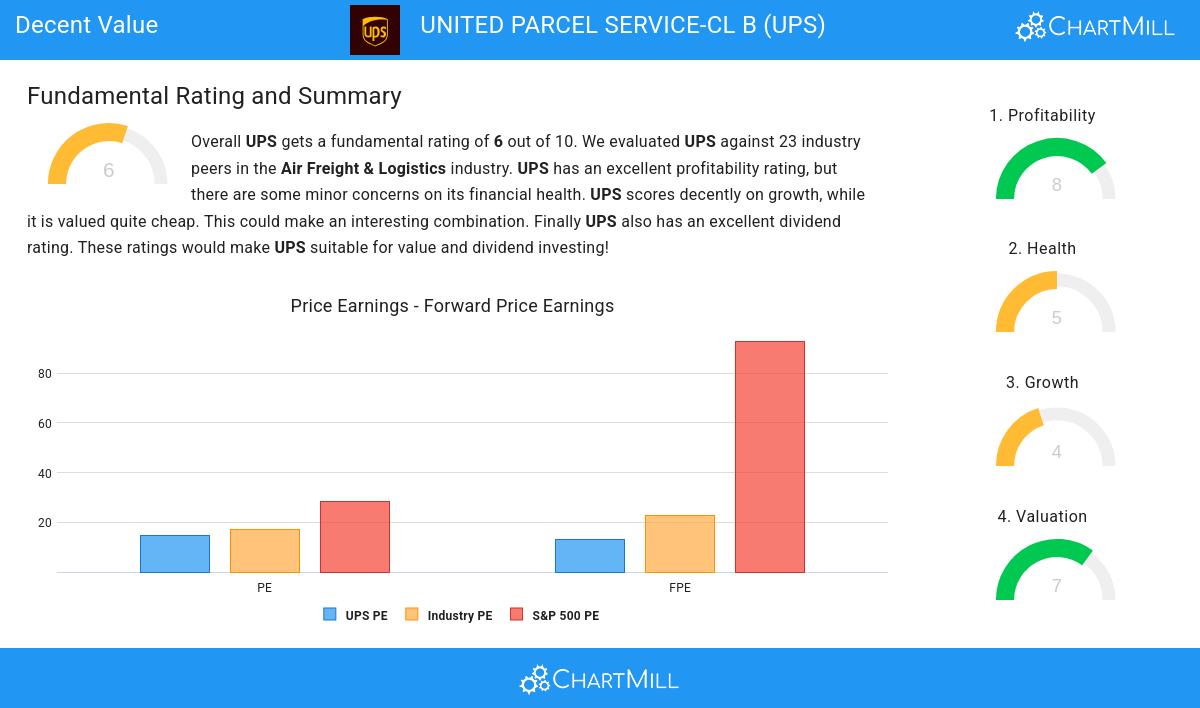
ChartMill assigns a proprietary Valuation Rating to each stock. The score is computed by evaluating various valuation aspects, like price to earnings and free cash flow, both absolutely as relative to the market and industry. NYSE:UPS was assigned a score of 7 for valuation:
- UPS's Price/Earnings ratio is a bit cheaper when compared to the industry. UPS is cheaper than 78.95% of the companies in the same industry.
- UPS's Price/Earnings ratio indicates a valuation a bit cheaper than the S&P500 average which is at 28.46.
- Based on the Price/Forward Earnings ratio, UPS is valued cheaply inside the industry as 84.21% of the companies are valued more expensively.
- The average S&P500 Price/Forward Earnings ratio is at 92.87. UPS is valued rather cheaply when compared to this.
- Compared to the rest of the industry, the Enterprise Value to EBITDA ratio of UPS indicates a somewhat cheap valuation: UPS is cheaper than 63.16% of the companies listed in the same industry.
- UPS's Price/Free Cash Flow ratio is rather cheap when compared to the industry. UPS is cheaper than 84.21% of the companies in the same industry.
- The excellent profitability rating of UPS may justify a higher PE ratio.
- UPS's earnings are expected to grow with 14.10% in the coming years. This may justify a more expensive valuation.
Looking at the Profitability
ChartMill employs its own Profitability Rating system for stock evaluation. This score, ranging from 0 to 10, is derived from an analysis of diverse profitability metrics and margins. In the case of NYSE:UPS, the assigned 8 is noteworthy for profitability:
- UPS's Return On Assets of 8.25% is fine compared to the rest of the industry. UPS outperforms 78.95% of its industry peers.
- Looking at the Return On Equity, with a value of 34.59%, UPS belongs to the top of the industry, outperforming 94.74% of the companies in the same industry.
- UPS's Return On Invested Capital of 12.38% is amongst the best of the industry. UPS outperforms 84.21% of its industry peers.
- UPS had an Average Return On Invested Capital over the past 3 years of 14.99%. This is above the industry average of 11.25%.
- Looking at the Profit Margin, with a value of 6.35%, UPS belongs to the top of the industry, outperforming 84.21% of the companies in the same industry.
- UPS has a Operating Margin of 9.35%. This is amongst the best in the industry. UPS outperforms 89.47% of its industry peers.
- The Gross Margin of UPS (80.28%) is better than 100.00% of its industry peers.
What does the Health looks like for NYSE:UPS
ChartMill employs its own Health Rating for stock assessment. This rating, ranging from 0 to 10, is calculated by examining various liquidity and solvency ratios. In the case of NYSE:UPS, the assigned 5 reflects its health status:
- UPS has an Altman-Z score of 3.26. This indicates that UPS is financially healthy and has little risk of bankruptcy at the moment.
- UPS has a better Altman-Z score (3.26) than 68.42% of its industry peers.
- UPS has a debt to FCF ratio of 3.43. This is a good value and a sign of high solvency as UPS would need 3.43 years to pay back of all of its debts.
- UPS has a better Debt to FCF ratio (3.43) than 68.42% of its industry peers.
Understanding NYSE:UPS's Growth Score
ChartMill employs its own Growth Rating system for all stocks. This score, ranging from 0 to 10, is derived by evaluating different growth factors, such as EPS and revenue growth, taking into account both past performance and future projections. NYSE:UPS has earned a 4 for growth:
- The Earnings Per Share is expected to grow by 12.99% on average over the next years. This is quite good.
- When comparing the EPS growth rate of the last years to the growth rate of the upcoming years, we see that the growth is accelerating.
- When comparing the Revenue growth rate of the last years to the growth rate of the upcoming years, we see that the growth is accelerating.
Our Decent Value screener lists more Decent Value stocks and is updated daily.
Check the latest full fundamental report of UPS for a complete fundamental analysis.
Keep in mind
Important Note: The content of this article is not intended as trading advice. It is essential to perform your own analysis and exercise caution when making trading decisions. The article presents observations created by automated analysis but does not guarantee any trading or investment outcomes. Always trade responsibly and make independent judgments.
