
Technical Insights for UBER TECHNOLOGIES INC (NYSE:UBER): Is a Breakout Imminent?
By Mill Chart
Last update: Sep 5, 2024
UBER TECHNOLOGIES INC (NYSE:UBER) was identified as a Technical Breakout Setup Pattern by our stockscreener. Such a pattern occurs when we see a pause in a strong uptrend: after a strong rise the stock is consolidating a bit and at some point the trend may be continued. Whether this actually happens can not be predicted of course, but it may be a good idea to keep and eye on NYSE:UBER.
In-Depth Technical Analysis of NYSE:UBER
ChartMill utilizes a proprietary algorithm to assign a Technical Rating to every stock. This rating, ranging from 0 to 10, is computed daily by analyzing a variety of technical indicators and properties.
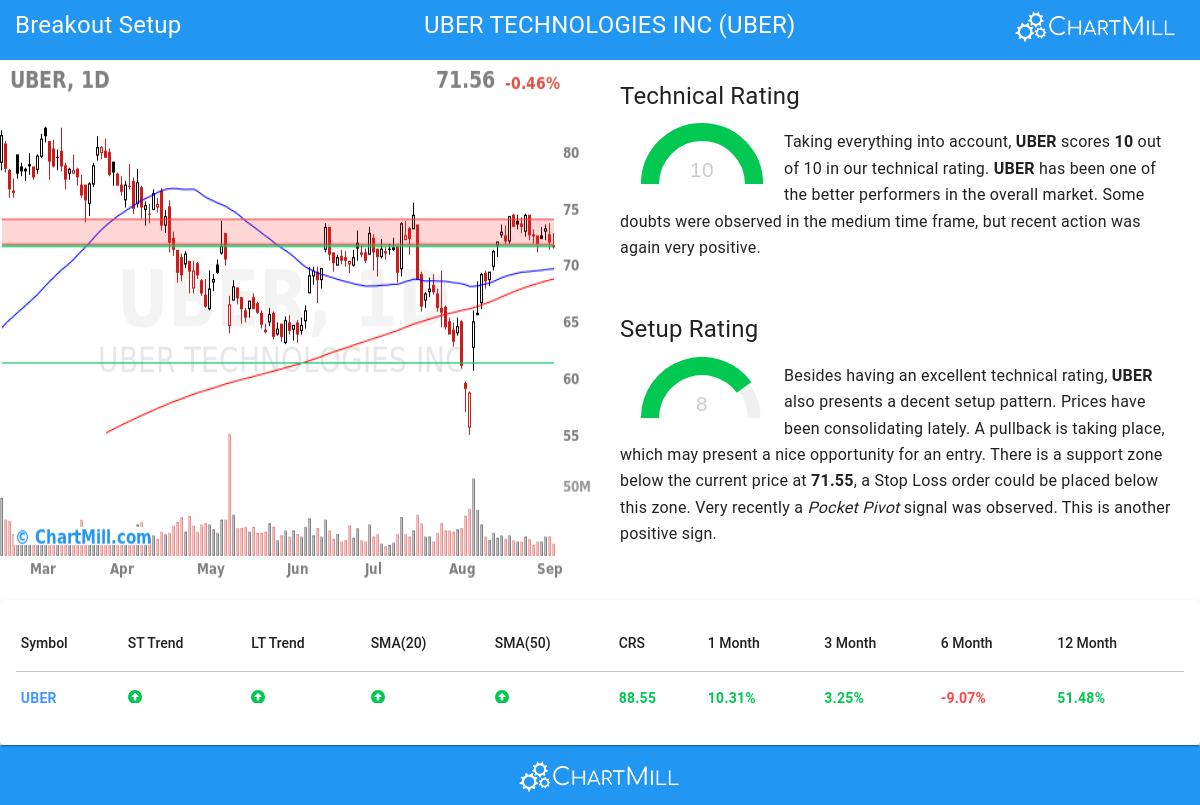
Overall UBER gets a technical rating of 10 out of 10. In the last year, UBER was one of the better performers in the market. There are positive signs in the very recent evolution, but the medium term picture is slightly mixed.
- Both the short term and long term trends are positive. This is a very positive sign.
- When comparing the yearly performance of all stocks, we notice that UBER is one of the better performing stocks in the market, outperforming 88% of all stocks. We also observe that the gains produced by UBER over the past year are nicely spread over this period.
- UBER is one of the better performing stocks in the Ground Transportation industry, it outperforms 77% of 37 stocks in the same industry.
- UBER is currently trading in the upper part of its 52 week range. The S&P500 Index however is currently trading near a new high, so UBER is lagging the market slightly.
- UBER is currently showing a bull flag pattern! A bull flag pattern occurs when prices pull back slightly after a strong rise up. This may be a nice opportunity for an entry.
For an up to date full technical analysis you can check the technical report of UBER
Looking at the Setup
Next to the Technical Rating, the Setup Rating of a stock determines to which extend the stock is consolidating. This score also ranges from 0 to 10 and is updated daily. The setup score evaluates various short term technical indicators. For NYSE:UBER this score is currently 8:
Besides having an excellent technical rating, UBER also presents a decent setup pattern. Prices have been consolidating lately. A pullback is taking place, which may present a nice opportunity for an entry. There is a support zone below the current price at 71.55, a Stop Loss order could be placed below this zone. Another positive sign is the recent Pocket Pivot signal.
How can NYSE:UBER be traded?
To potentially initiate a trade, it is common practice to wait for the stock to break out of the consolidation zone. This breakout signifies a potential upward movement, and traders may enter the stock at that point. Conversely, if the stock falls back below the consolidation zone, it may be sold at a loss.
Important Note: The content of this article is not intended as trading advice. It is essential to perform your own analysis and exercise caution when making trading decisions. The article presents technical observations generated by automated analysis but does not guarantee any trading outcomes. Always trade responsibly and make independent judgments.
Our Breakout screener lists more breakout setups and is updated daily.
Keep in mind
Important Note: The content of this article is not intended as trading advice. It is essential to perform your own analysis and exercise caution when making trading decisions. The article presents observations created by automated analysis but does not guarantee any trading or investment outcomes. Always trade responsibly and make independent judgments.
81.01
+1.59 (+2%)
Find more stocks in the Stock Screener
UBER Latest News and Analysis
 9 days ago - ChartmillMarket Monitor April 22 ( Netflix UP, Tesla, Uber DOWN)
Wall Street Stumbles as Trump Targets Fed Chair Powell Again, While Netflix Shines
