
UNITED AIRLINES HOLDINGS INC (NASDAQ:UAL) Reveals Intriguing Technical Aspects. Here's What You Need to Know.
By Mill Chart
Last update: Feb 5, 2025
UNITED AIRLINES HOLDINGS INC (NASDAQ:UAL) was identified as a Technical Breakout Setup Pattern by our stockscreener. Such a pattern occurs when we see a pause in a strong uptrend: after a strong rise the stock is consolidating a bit and at some point the trend may be continued. Whether this actually happens can not be predicted of course, but it may be a good idea to keep and eye on NASDAQ:UAL.
Zooming in on the technicals.
Every day ChartMill assigns a Technical Rating to every stock. The score ranges from 0 to 10 and is determined by evaluating multiple technical indicators and properties.
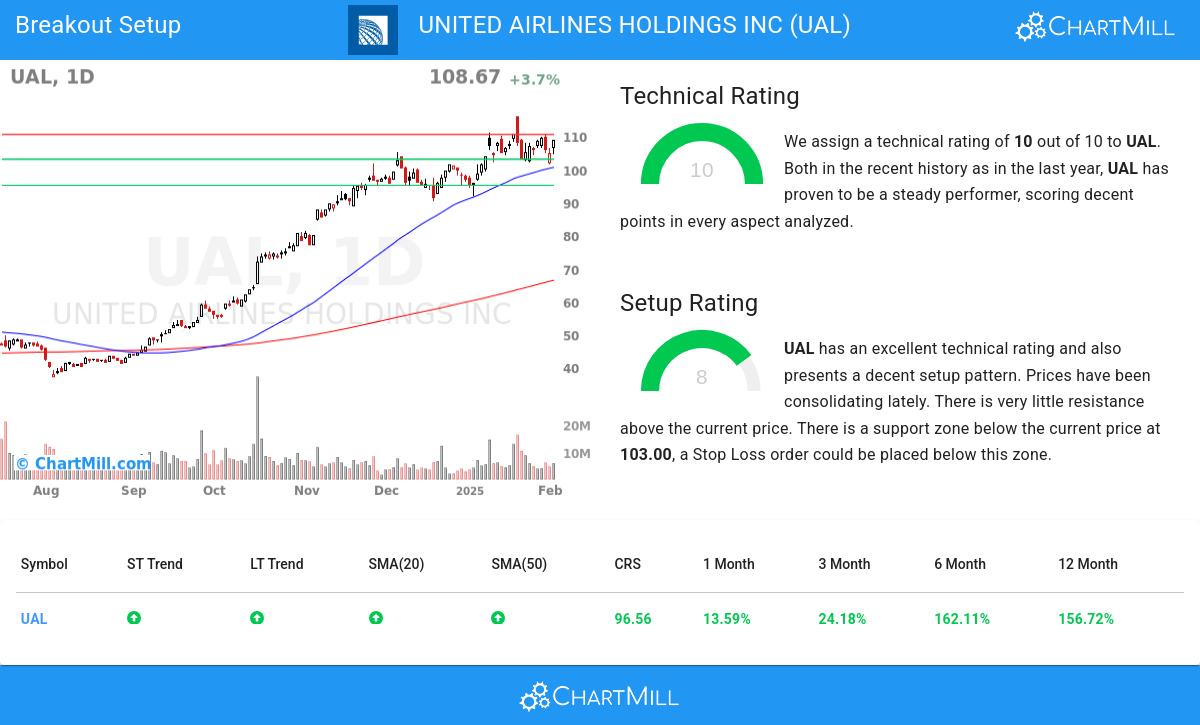
Overall UAL gets a technical rating of 10 out of 10. This is due to a consistent performance in both the short and longer term time frames. Also compared to the overall market, UAL is showing a nice and steady performance.
- The long and short term trends are both positive. This is looking good!
- Looking at the yearly performance, UAL did better than 96% of all other stocks.
- UAL is one of the better performing stocks in the Passenger Airlines industry, it outperforms 100% of 23 stocks in the same industry.
- UAL is currently trading in the upper part of its 52 week range. The S&P500 Index however is currently trading near a new high, so UAL is lagging the market slightly.
- In the last month UAL has a been trading in the 96.37 - 116.00 range, which is quite wide. It is currently trading in the middle of this range, so some resistance may be found above.
For an up to date full technical analysis you can check the technical report of UAL
Why is NASDAQ:UAL a setup?
Besides the Technical Rating, ChartMill also assign a Setup Rating to every stock. This setup score also ranges from 0 to 10 and determines to which extend the stock is consolidating. This is achieved by evaluating multiple short term technical indicators. NASDAQ:UAL currently has a 8 as setup rating:
UAL has an excellent technical rating and also presents a decent setup pattern. Prices have been consolidating lately. There is very little resistance above the current price. There is a support zone below the current price at 103.00, a Stop Loss order could be placed below this zone.
Trading setups like NASDAQ:UAL
A breakout could materialize when the stock breaks out to new highs above the current consolidation zone. One could wait for this to happen and buy when this happens. A stop loss could be placed below the consolidation zone.
Important Note: The content of this article is not intended as trading advice. It is essential to perform your own analysis and exercise caution when making trading decisions. The article presents technical observations generated by automated analysis but does not guarantee any trading outcomes. Always trade responsibly and make independent judgments.
More breakout setups can be found in our Breakout screener.
Keep in mind
Important Note: The content of this article is not intended as trading advice. It is essential to perform your own analysis and exercise caution when making trading decisions. The article presents observations created by automated analysis but does not guarantee any trading or investment outcomes. Always trade responsibly and make independent judgments.
66.97
+1.67 (+2.56%)
Find more stocks in the Stock Screener
UAL Latest News and Analysis
 7 days ago - ChartmillWednesday's pre-market session: top gainers and losers in the S&P500 index
Before the US market kicks off on Wednesday, let's examine the pre-market session and unveil the notable performers among the S&P500 top gainers and losers.
 7 days ago - ChartmillTuesday's after hours session: top gainers and losers
As the regular session of the US market concludes on Tuesday, let's get an insight into the after-hours session and identify the stocks leading the pack in terms of gains and losses.
 7 days ago - ChartmillWhich S&P500 stocks are moving on Tuesday?
Stay informed about the performance of the S&P500 index in the middle of the day on Tuesday. Uncover the top gainers and losers in today's session for valuable insights.
12 days ago - ChartmillWhat's going on in today's session: S&P500 moversStay updated with the movements of the S&P500 index in the middle of the day on Thursday. Discover which stocks are leading as top gainers and losers in today's session.
13 days ago - ChartmillThese S&P500 stocks are moving in today's sessionGet insights into the S&P500 index performance on Wednesday. Explore the top gainers and losers within the S&P500 index in today's session.
 19 days ago - ChartmillFriday's session: gap up and gap down stock in the S&P500 index
Let's have a look at what is happening on the US markets on Friday. Below you can find the S&P500 gap up and gap down stocks in today's session.
19 days ago - ChartmillThese S&P500 stocks are moving in today's pre-market sessionStay updated with the S&P500 stocks that are on the move in today's pre-market session.
20 days ago - ChartmillStay informed with the top movers within the S&P500 index on Wednesday.Get insights into the S&P500 index performance on Wednesday. Explore the top gainers and losers within the S&P500 index in today's session.
21 days ago - ChartmillTop S&P500 movers in Wednesday's pre-market sessionDiscover the top S&P500 movers in Wednesday's pre-market session and stay informed about market dynamics.
