
Why NYSE:TTE is a Top Pick for Dividend Investors.
By Mill Chart
Last update: Sep 18, 2024
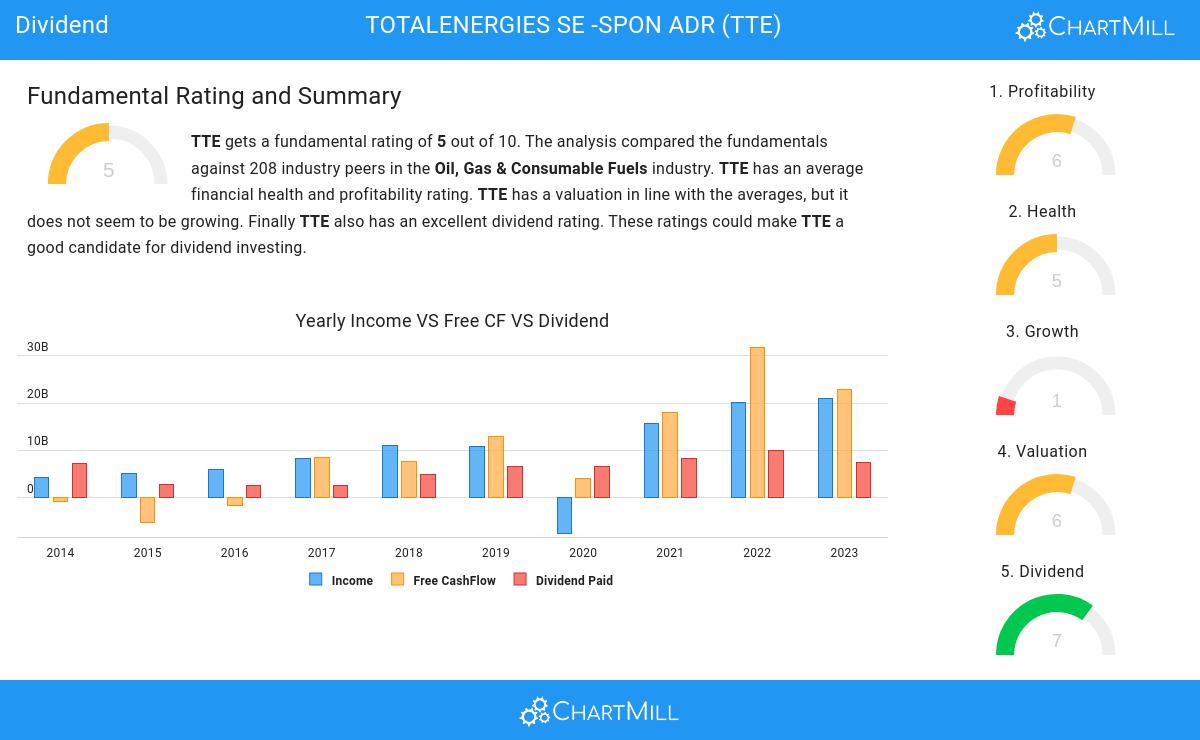
Consider TOTALENERGIES SE -SPON ADR (NYSE:TTE) as a top pick for dividend investors, identified by our stock screening tool. NYSE:TTE shines in terms of profitability, solvency, and liquidity, all while paying a decent dividend. Let's dive deeper into the analysis.
Evaluating Dividend: NYSE:TTE
ChartMill assigns a Dividend Rating to each stock, ranging from 0 to 10. This rating is calculated by analyzing various dividend elements, such as yield, historical performance, dividend growth, and sustainability. NYSE:TTE has been awarded a 7 for its dividend quality:
- TTE has a Yearly Dividend Yield of 5.11%, which is a nice return.
- TTE's Dividend Yield is a higher than the industry average which is at 6.25.
- TTE's Dividend Yield is rather good when compared to the S&P500 average which is at 2.26.
- The dividend of TTE is nicely growing with an annual growth rate of 10.18%!
- TTE has paid a dividend for at least 10 years, which is a reliable track record.
- 36.18% of the earnings are spent on dividend by TTE. This is a low number and sustainable payout ratio.
Evaluating Health: NYSE:TTE
ChartMill assigns a Health Rating to every stock. This score ranges from 0 to 10 and evaluates the different health aspects like liquidity and solvency, both absolutely, but also relative to the industry peers. NYSE:TTE scores a 5 out of 10:
- The Debt to FCF ratio of TTE is 2.58, which is a good value as it means it would take TTE, 2.58 years of fcf income to pay off all of its debts.
- TTE has a Debt to FCF ratio of 2.58. This is in the better half of the industry: TTE outperforms 73.56% of its industry peers.
- TTE has a Debt/Equity ratio of 0.36. This is a healthy value indicating a solid balance between debt and equity.
Profitability Assessment of NYSE:TTE
Discover ChartMill's exclusive Profitability Rating, a proprietary metric that assesses stocks on a scale of 0 to 10. It takes into consideration various profitability ratios and margins, both in absolute terms and relative to industry peers. Notably, NYSE:TTE has achieved a 6:
- TTE has a better Return On Assets (7.50%) than 65.38% of its industry peers.
- TTE has a Return On Equity of 17.86%. This is in the better half of the industry: TTE outperforms 65.38% of its industry peers.
- TTE has a better Return On Invested Capital (13.22%) than 74.52% of its industry peers.
- In the last couple of years the Profit Margin of TTE has grown nicely.
- TTE's Operating Margin has improved in the last couple of years.
- TTE's Gross Margin has improved in the last couple of years.
Our Best Dividend screener lists more Best Dividend stocks and is updated daily.
For an up to date full fundamental analysis you can check the fundamental report of TTE
Disclaimer
This is not investing advice! The article highlights some of the observations at the time of writing, but you should always make your own analysis and invest based on your own insights.