Balancing Dividends and Fundamentals: The Case of TORO CO (NYSE:TTC).
By Mill Chart
Last update: Apr 26, 2025
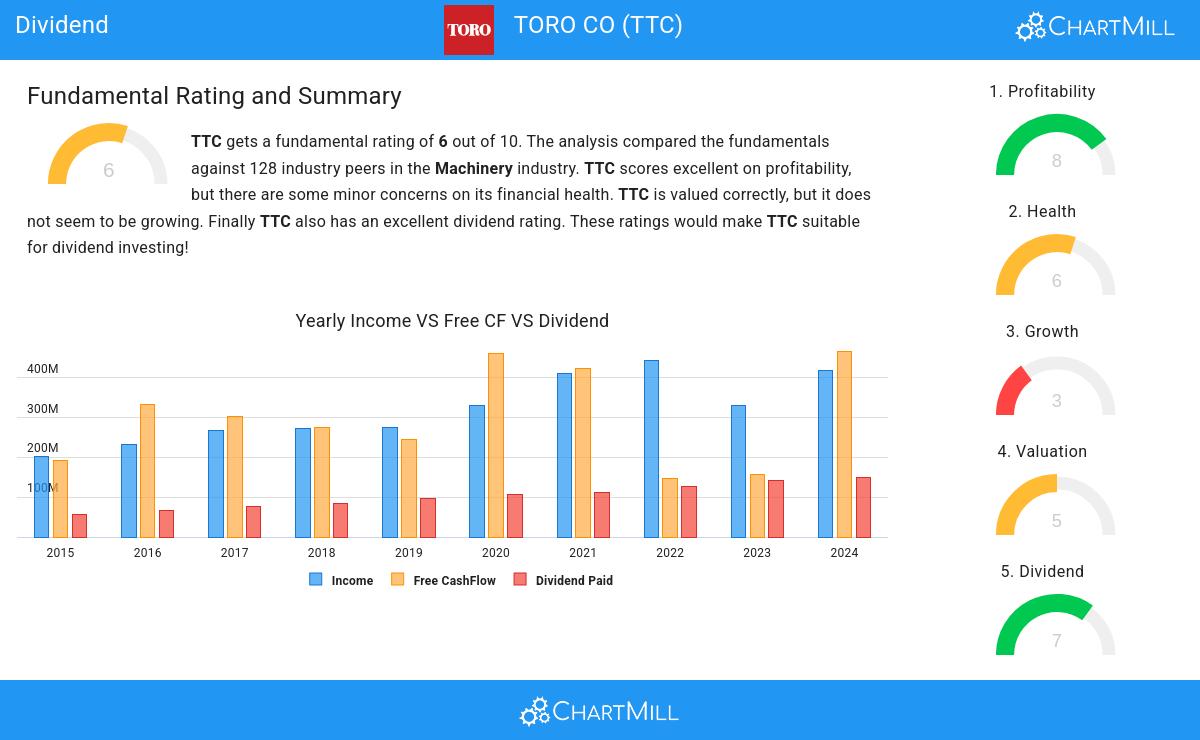
TORO CO (NYSE:TTC) has caught the attention of dividend investors as a stock worth considering. TTC excels in profitability, solvency, and liquidity, all while providing a decent dividend. Let's delve into the details.
Dividend Insights: TTC
ChartMill assigns a Dividend Rating to every stock. This score ranges from 0 to 10 and evaluates the different dividend aspects, including the yield, the growth and sustainability. TTC scores a 7 out of 10:
- TTC's Dividend Yield is rather good when compared to the industry average which is at 2.12. TTC pays more dividend than 84.38% of the companies in the same industry.
- On average, the dividend of TTC grows each year by 9.97%, which is quite nice.
- TTC has been paying a dividend for at least 10 years, so it has a reliable track record.
- TTC has not decreased its dividend for at least 10 years, so it has a reliable track record of non decreasing dividend.
- TTC pays out 36.97% of its income as dividend. This is a sustainable payout ratio.
Analyzing Health Metrics
ChartMill utilizes a Health Rating to assess stocks, scoring them on a scale of 0 to 10. This rating takes into account a variety of liquidity and solvency ratios, both in absolute terms and in comparison to industry peers. TTC has earned a 6 out of 10:
- TTC has an Altman-Z score of 4.38. This indicates that TTC is financially healthy and has little risk of bankruptcy at the moment.
- With a decent Altman-Z score value of 4.38, TTC is doing good in the industry, outperforming 72.66% of the companies in the same industry.
- TTC has a debt to FCF ratio of 2.17. This is a good value and a sign of high solvency as TTC would need 2.17 years to pay back of all of its debts.
- TTC has a Debt to FCF ratio of 2.17. This is in the better half of the industry: TTC outperforms 76.56% of its industry peers.
- Although TTC does not score too well on debt/equity it has very limited outstanding debt, which is well covered by the FCF. We will not put too much weight on the debt/equity number as it may be because of low equity, which could be a consequence of a share buyback program for instance. This needs to be investigated.
What does the Profitability looks like for TTC
ChartMill's Profitability Rating offers a unique perspective on stock analysis, providing scores from 0 to 10. These ratings consider a wide range of profitability metrics and margins, both in comparison to industry peers and on their own merits. For TTC, the assigned 8 is a significant indicator of profitability:
- TTC has a better Return On Assets (11.00%) than 81.25% of its industry peers.
- With an excellent Return On Equity value of 27.72%, TTC belongs to the best of the industry, outperforming 92.19% of the companies in the same industry.
- TTC's Return On Invested Capital of 15.85% is amongst the best of the industry. TTC outperforms 88.28% of its industry peers.
- The Average Return On Invested Capital over the past 3 years for TTC is significantly above the industry average of 10.69%.
- TTC's Profit Margin of 8.89% is fine compared to the rest of the industry. TTC outperforms 65.63% of its industry peers.
- Looking at the Operating Margin, with a value of 11.42%, TTC is in the better half of the industry, outperforming 60.16% of the companies in the same industry.
- TTC's Operating Margin has improved in the last couple of years.
More Best Dividend stocks can be found in our Best Dividend screener.
Check the latest full fundamental report of TTC for a complete fundamental analysis.
Disclaimer
Important Note: The content of this article is not intended as trading advice. It is essential to perform your own analysis and exercise caution when making trading decisions. The article presents observations created by automated analysis but does not guarantee any trading or investment outcomes. Always trade responsibly and make independent judgments.
68.03
-0.86 (-1.25%)
Find more stocks in the Stock Screener
TTC Latest News and Analysis
 2 minutes ago - ChartmillBalancing Dividends and Fundamentals: The Case of TORO CO (NYSE:TTC).
Balancing Dividends and Fundamentals: The Case of TORO CO (NYSE:TTC).
