NYSE:TSM—A High-Growth Stock Gearing Up for Its Next Upward Move.
By Mill Chart
Last update: Feb 7, 2025
Groth investors are looking for stocks showing high revenue and EPS growth. We will have a look here to see if TAIWAN SEMICONDUCTOR-SP ADR (NYSE:TSM) is suited for growth investing, while it is forming a base and may be ready to breakout. Investors should of course do their own research, but we spotted TAIWAN SEMICONDUCTOR-SP ADR showing up in our growth with base formation screen, so it may be worth spending some more time on it.
Understanding NYSE:TSM's Growth
ChartMill assigns a Growth Rating to each stock, ranging from 0 to 10. This rating is determined by analyzing different growth elements, including EPS and revenue growth, spanning both historical and future figures. In the case of NYSE:TSM, the assigned 8 reflects its growth potential:
- TSM shows a strong growth in Earnings Per Share. In the last year, the EPS has been growing by 39.91%, which is quite impressive.
- TSM shows a strong growth in Earnings Per Share. Measured over the last years, the EPS has been growing by 27.73% yearly.
- The Revenue has grown by 33.89% in the past year. This is a very strong growth!
- The Revenue has been growing by 22.02% on average over the past years. This is a very strong growth!
- The Earnings Per Share is expected to grow by 16.90% on average over the next years. This is quite good.
- Based on estimates for the next years, TSM will show a quite strong growth in Revenue. The Revenue will grow by 15.47% on average per year.
Health Assessment of NYSE:TSM
Every stock is evaluated by ChartMill, receiving a Health Rating on a scale of 0 to 10. This assessment considers different health aspects, including liquidity and solvency, both in absolute terms and relative to industry peers. NYSE:TSM has achieved a 5 out of 10:
- TSM has a debt to FCF ratio of 1.13. This is a very positive value and a sign of high solvency as it would only need 1.13 years to pay back of all of its debts.
- With a decent Debt to FCF ratio value of 1.13, TSM is doing good in the industry, outperforming 78.70% of the companies in the same industry.
- A Debt/Equity ratio of 0.22 indicates that TSM is not too dependend on debt financing.
- TSM has a Current Ratio of 2.44. This indicates that TSM is financially healthy and has no problem in meeting its short term obligations.
- TSM has a Quick Ratio of 2.21. This indicates that TSM is financially healthy and has no problem in meeting its short term obligations.
Profitability Examination for NYSE:TSM
ChartMill assigns a proprietary Profitability Rating to each stock. The score is computed by evaluating various profitability ratios and margins and ranges from 0 to 10. NYSE:TSM was assigned a score of 9 for profitability:
- Looking at the Return On Assets, with a value of 17.53%, TSM belongs to the top of the industry, outperforming 91.67% of the companies in the same industry.
- The Return On Equity of TSM (27.36%) is better than 89.81% of its industry peers.
- TSM has a better Return On Invested Capital (20.58%) than 92.59% of its industry peers.
- Measured over the past 3 years, the Average Return On Invested Capital for TSM is significantly above the industry average of 12.01%.
- The last Return On Invested Capital (20.58%) for TSM is above the 3 year average (20.33%), which is a sign of increasing profitability.
- With an excellent Profit Margin value of 40.54%, TSM belongs to the best of the industry, outperforming 96.30% of the companies in the same industry.
- In the last couple of years the Profit Margin of TSM has grown nicely.
- TSM has a better Operating Margin (45.68%) than 98.15% of its industry peers.
- In the last couple of years the Operating Margin of TSM has grown nicely.
- The Gross Margin of TSM (56.12%) is better than 77.78% of its industry peers.
- TSM's Gross Margin has improved in the last couple of years.
How do we evaluate the setup for NYSE:TSM?
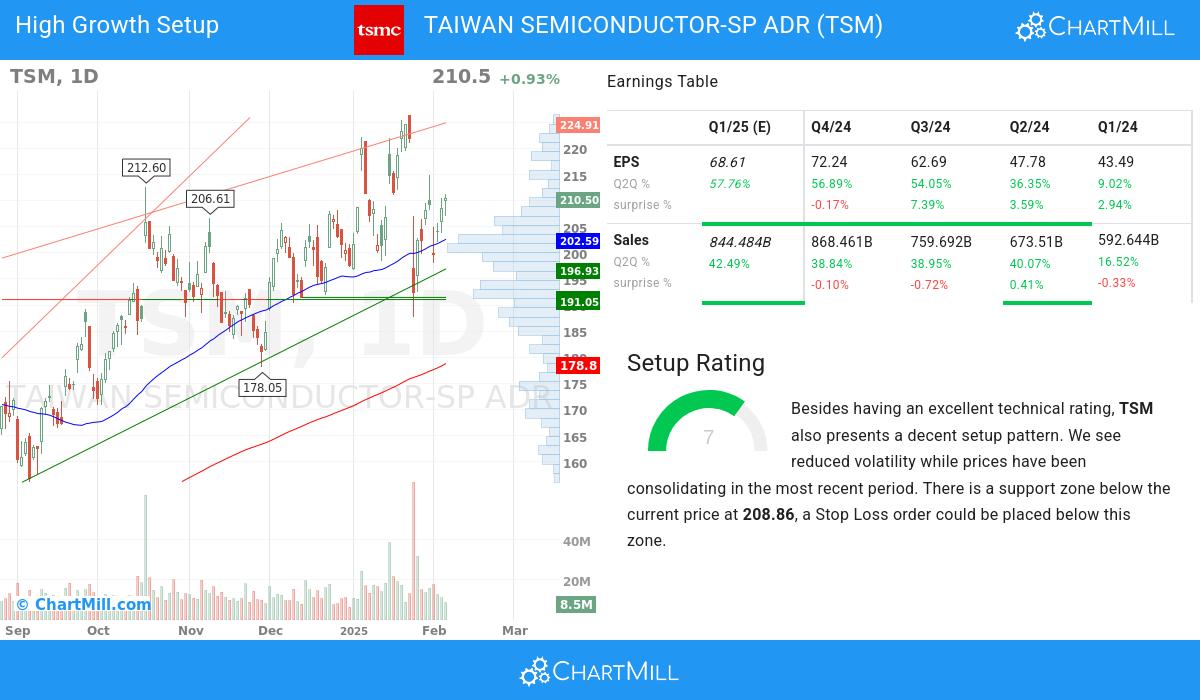
ChartMill also assign a Setup Rating to every stock. With this score it is determined to what extend the stock has been trading in a range in the recent days and weeks. This score also ranges from 0 to 10 and is updated daily. The setup score evaluates various short term technical indicators. NYSE:TSM scores a 7 out of 10:
Besides having an excellent technical rating, TSM also presents a decent setup pattern. Prices have been consolidating lately and the volatility has been reduced. There is a support zone below the current price at 208.86, a Stop Loss order could be placed below this zone.
Our Strong Growth screener lists more Strong Growth stocks and is updated daily.
Check the latest full fundamental report of TSM for a complete fundamental analysis.
Our latest full technical report of TSM contains the most current technical analsysis.
Disclaimer
This is not investing advice! The article highlights some of the observations at the time of writing, but you should always make your own analysis and invest based on your own insights.
292.04
-12.81 (-4.2%)
Find more stocks in the Stock Screener
TSM Latest News and Analysis