
Investors should take note of TESLA INC (NASDAQ:TSLA), a growth stock that remains attractively priced.
By Mill Chart
Last update: Mar 18, 2025
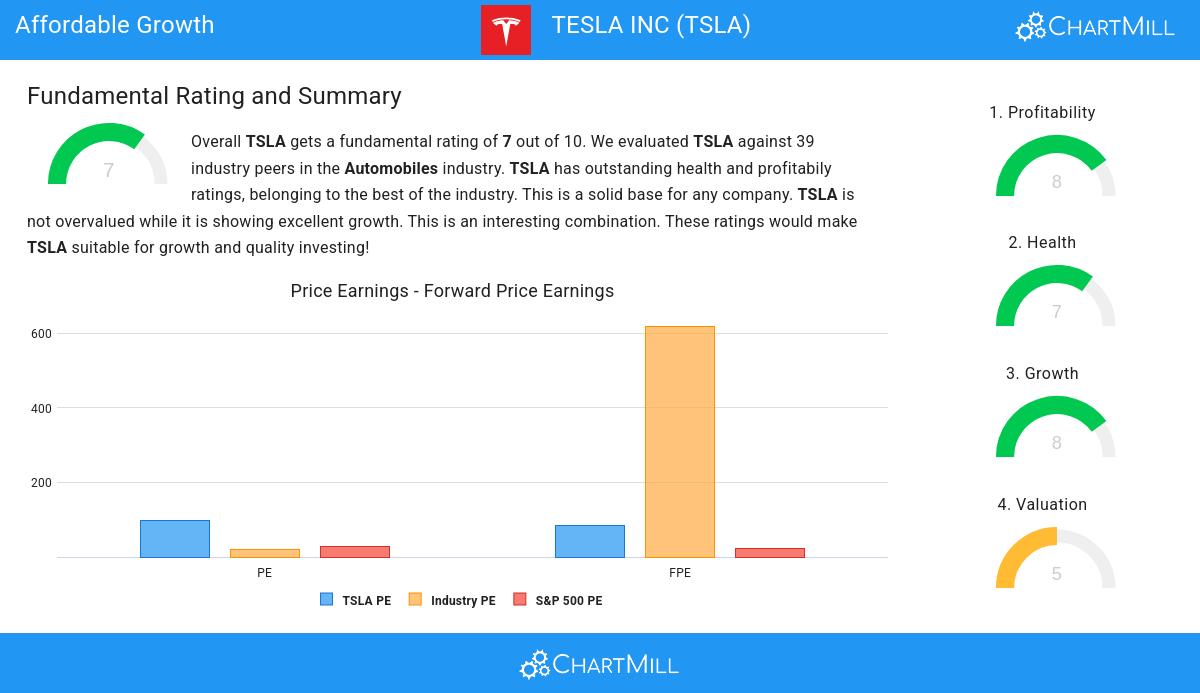
Our stock screener has singled out TESLA INC (NASDAQ:TSLA) as an attractive growth opportunity. TSLA is demonstrating remarkable growth potential while maintaining strong financial indicators, making it a reasonably priced option. We'll explore this further.
Unpacking TSLA's Growth Rating
ChartMill assigns a Growth Rating to every stock. This score ranges from 0 to 10 and evaluates the different growth aspects like EPS and Revenue, both in the past as in the future. TSLA scores a 8 out of 10:
- Measured over the past years, TSLA shows a very strong growth in Earnings Per Share. The EPS has been growing by 103.90% on average per year.
- Measured over the past years, TSLA shows a very strong growth in Revenue. The Revenue has been growing by 31.78% on average per year.
- Based on estimates for the next years, TSLA will show a very strong growth in Earnings Per Share. The EPS will grow by 33.23% on average per year.
- TSLA is expected to show a strong growth in Revenue. In the coming years, the Revenue will grow by 21.08% yearly.
Valuation Analysis for TSLA
ChartMill employs its own Valuation Rating system for all stocks. This score, ranging from 0 to 10, is determined by evaluating different valuation factors, including price to earnings and free cash flow, both in absolute terms and relative to the market and industry. TSLA has earned a 5 for valuation:
- Compared to the rest of the industry, the Price/Earnings ratio of TSLA indicates a somewhat cheap valuation: TSLA is cheaper than 69.23% of the companies listed in the same industry.
- TSLA's Price/Forward Earnings ratio is a bit cheaper when compared to the industry. TSLA is cheaper than 69.23% of the companies in the same industry.
- Based on the Enterprise Value to EBITDA ratio, TSLA is valued a bit cheaper than the industry average as 64.10% of the companies are valued more expensively.
- Based on the Price/Free Cash Flow ratio, TSLA is valued cheaply inside the industry as 82.05% of the companies are valued more expensively.
- The excellent profitability rating of TSLA may justify a higher PE ratio.
- A more expensive valuation may be justified as TSLA's earnings are expected to grow with 22.51% in the coming years.
Deciphering TSLA's Health Rating
ChartMill assigns a proprietary Health Rating to each stock. The score is computed by evaluating various liquidity and solvency ratios and ranges from 0 to 10. TSLA was assigned a score of 7 for health:
- An Altman-Z score of 11.05 indicates that TSLA is not in any danger for bankruptcy at the moment.
- TSLA's Altman-Z score of 11.05 is amongst the best of the industry. TSLA outperforms 100.00% of its industry peers.
- TSLA has a debt to FCF ratio of 2.29. This is a good value and a sign of high solvency as TSLA would need 2.29 years to pay back of all of its debts.
- Looking at the Debt to FCF ratio, with a value of 2.29, TSLA belongs to the top of the industry, outperforming 94.87% of the companies in the same industry.
- TSLA has a Debt/Equity ratio of 0.08. This is a healthy value indicating a solid balance between debt and equity.
- TSLA's Debt to Equity ratio of 0.08 is amongst the best of the industry. TSLA outperforms 84.62% of its industry peers.
- A Current Ratio of 2.02 indicates that TSLA has no problem at all paying its short term obligations.
- TSLA's Current ratio of 2.02 is fine compared to the rest of the industry. TSLA outperforms 71.79% of its industry peers.
- With a decent Quick ratio value of 1.61, TSLA is doing good in the industry, outperforming 76.92% of the companies in the same industry.
What does the Profitability looks like for TSLA
ChartMill assigns a proprietary Profitability Rating to each stock. The score is computed by evaluating various profitability ratios and margins and ranges from 0 to 10. TSLA was assigned a score of 8 for profitability:
- TSLA has a Return On Assets of 5.84%. This is amongst the best in the industry. TSLA outperforms 89.74% of its industry peers.
- The Return On Equity of TSLA (9.78%) is better than 79.49% of its industry peers.
- The Return On Invested Capital of TSLA (6.62%) is better than 89.74% of its industry peers.
- Measured over the past 3 years, the Average Return On Invested Capital for TSLA is above the industry average of 8.95%.
- The 3 year average ROIC (11.83%) for TSLA is well above the current ROIC(6.62%). The reason for the recent decline needs to be investigated.
- TSLA has a better Profit Margin (7.30%) than 87.18% of its industry peers.
- Looking at the Operating Margin, with a value of 7.94%, TSLA belongs to the top of the industry, outperforming 84.62% of the companies in the same industry.
- In the last couple of years the Operating Margin of TSLA has grown nicely.
- TSLA's Gross Margin of 17.86% is fine compared to the rest of the industry. TSLA outperforms 69.23% of its industry peers.
- TSLA's Gross Margin has improved in the last couple of years.
Our Affordable Growth screener lists more Affordable Growth stocks and is updated daily.
Our latest full fundamental report of TSLA contains the most current fundamental analsysis.
Keep in mind
Important Note: The content of this article is not intended as trading advice. It is essential to perform your own analysis and exercise caution when making trading decisions. The article presents observations created by automated analysis but does not guarantee any trading or investment outcomes. Always trade responsibly and make independent judgments.
241.37
-0.18 (-0.07%)
Find more stocks in the Stock Screener
TSLA Latest News and Analysis
 20 hours ago - ChartmillThursday's session: most active stock in the S&P500 index
Looking for the most active S&P500 stocks in today's session? Join us as we dive into the US markets on Thursday and discover the stocks that are dominating the trading activity and setting the pace for the market.
2 days ago - ChartmillMost active S&P500 stocks in Wednesday's sessionStay informed about the most active S&P500 stocks in today's session as we take a closer look at what's happening on the US markets on Wednesday. Discover the stocks that are generating the highest trading volume and driving market activity.
3 days ago - ChartmillMost active S&P500 stocks in Tuesday's sessionStay informed about the most active S&P500 stocks in today's session as we take a closer look at what's happening on the US markets on Tuesday. Discover the stocks that are generating the highest trading volume and driving market activity.
4 days ago - ChartmillWhat's going on in today's session: S&P500 most active stocksExplore the S&P500 index on Monday and find out which stocks are the most active in today's session. Stay updated with the stocks that are capturing market interest.
7 days ago - ChartmillWhich S&P500 stocks are the most active on Friday?Looking for the most active stocks in the S&P500 index on Friday? Dive into today's session and discover the stocks that are dominating the trading activity and setting the pace for the market.
7 days ago - ChartmillCheck out the stocks that are attracting the most attention and driving market activity.Discover the most active stocks in Friday's session. Stay informed about the stocks that are generating the most trading volume!
8 days ago - ChartmillWhat's going on in today's session: S&P500 most active stocksLet's have a look at what is happening on the US markets on Thursday. Below you can find the most active S&P500 stocks in today's session.
8 days ago - ChartmillMost active stocks in Thursday's sessionCurious about the most active stocks in today's session? Get a glimpse into the stocks that are generating the highest trading volume and capturing market attention.
 9 days ago - ChartmillThese S&P500 stocks are moving in today's session
Get insights into the S&P500 index performance on Wednesday. Explore the top gainers and losers within the S&P500 index in today's session.
9 days ago - ChartmillMost active S&P500 stocks in Wednesday's sessionStay informed about the most active stocks in the S&P500 index on Wednesday's session. Discover the stocks that are generating the highest trading volume and driving market activity.
9 days ago - ChartmillThese stocks are making the most noise in today's session.Wednesday's session is buzzing with activity. Check out the stocks that are attracting the most attention and driving market activity!
9 days ago - ChartmillWhat's going on in today's session: S&P500 moversStay informed about the performance of the S&P500 index in the middle of the day on Wednesday. Uncover the top gainers and losers in today's session for valuable insights.
