Despite its impressive fundamentals, NYSE:TPH remains undervalued.
By Mill Chart
Last update: Sep 5, 2024
TRI POINTE HOMES INC (NYSE:TPH) has caught the attention of our stock screener as a great value stock. NYSE:TPH excels in profitability, solvency, and liquidity, all while being very reasonably priced. Let's delve into the details.
What does the Valuation looks like for NYSE:TPH
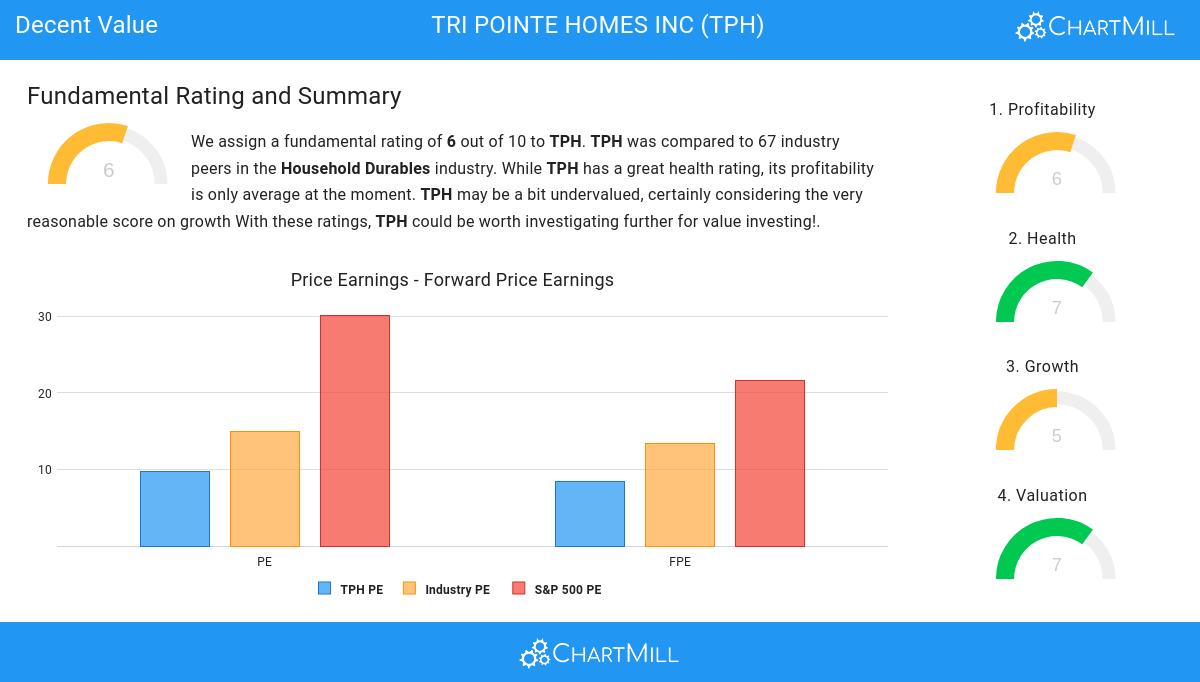
To assess a stock's valuation, ChartMill utilizes a Valuation Rating on a scale of 0 to 10. This comprehensive assessment considers various valuation aspects, comparing price to earnings and cash flows, while factoring in profitability and growth. NYSE:TPH has achieved a 7 out of 10:
- The Price/Earnings ratio is 9.73, which indicates a very decent valuation of TPH.
- Based on the Price/Earnings ratio, TPH is valued a bit cheaper than 76.92% of the companies in the same industry.
- When comparing the Price/Earnings ratio of TPH to the average of the S&P500 Index (30.17), we can say TPH is valued rather cheaply.
- TPH is valuated reasonably with a Price/Forward Earnings ratio of 8.49.
- Based on the Price/Forward Earnings ratio, TPH is valued cheaply inside the industry as 84.62% of the companies are valued more expensively.
- When comparing the Price/Forward Earnings ratio of TPH to the average of the S&P500 Index (21.56), we can say TPH is valued rather cheaply.
- Based on the Enterprise Value to EBITDA ratio, TPH is valued a bit cheaper than 72.31% of the companies in the same industry.
- TPH's low PEG Ratio(NY), which compensates the Price/Earnings for growth, indicates a rather cheap valuation of the company.
- The decent profitability rating of TPH may justify a higher PE ratio.
- TPH's earnings are expected to grow with 17.98% in the coming years. This may justify a more expensive valuation.
What does the Profitability looks like for NYSE:TPH
ChartMill's Profitability Rating offers a unique perspective on stock analysis, providing scores from 0 to 10. These ratings consider a wide range of profitability metrics and margins, both in comparison to industry peers and on their own merits. For NYSE:TPH, the assigned 6 is a significant indicator of profitability:
- TPH's Return On Assets of 9.25% is fine compared to the rest of the industry. TPH outperforms 69.23% of its industry peers.
- TPH's Profit Margin of 10.14% is fine compared to the rest of the industry. TPH outperforms 78.46% of its industry peers.
- TPH's Profit Margin has improved in the last couple of years.
- TPH has a better Operating Margin (12.52%) than 72.31% of its industry peers.
Understanding NYSE:TPH's Health
ChartMill assigns a Health Rating to every stock. This score ranges from 0 to 10 and evaluates the different health aspects like liquidity and solvency, both absolutely, but also relative to the industry peers. NYSE:TPH scores a 7 out of 10:
- TPH has an Altman-Z score of 4.85. This indicates that TPH is financially healthy and has little risk of bankruptcy at the moment.
- TPH has a better Altman-Z score (4.85) than 73.85% of its industry peers.
- TPH has a Debt/Equity ratio of 0.31. This is a healthy value indicating a solid balance between debt and equity.
- TPH has a Current Ratio of 8.37. This indicates that TPH is financially healthy and has no problem in meeting its short term obligations.
- Looking at the Current ratio, with a value of 8.37, TPH belongs to the top of the industry, outperforming 89.23% of the companies in the same industry.
- TPH's Quick ratio of 1.24 is fine compared to the rest of the industry. TPH outperforms 70.77% of its industry peers.
Understanding NYSE:TPH's Growth
ChartMill assigns a Growth Rating to every stock. This score ranges from 0 to 10 and evaluates the different growth aspects like EPS and Revenue, both in the past as in the future. NYSE:TPH scores a 5 out of 10:
- The Earnings Per Share has been growing by 13.52% on average over the past years. This is quite good.
- TPH is expected to show quite a strong growth in Earnings Per Share. In the coming years, the EPS will grow by 17.98% yearly.
- Based on estimates for the next years, TPH will show a quite strong growth in Revenue. The Revenue will grow by 10.20% on average per year.
- When comparing the EPS growth rate of the last years to the growth rate of the upcoming years, we see that the growth is accelerating.
- When comparing the Revenue growth rate of the last years to the growth rate of the upcoming years, we see that the growth is accelerating.
Every day, new Decent Value stocks can be found on ChartMill in our Decent Value screener.
Our latest full fundamental report of TPH contains the most current fundamental analsysis.
Keep in mind
This article should in no way be interpreted as advice. The article is based on the observed metrics at the time of writing, but you should always make your own analysis and trade or invest at your own responsibility.
30.33
-0.53 (-1.72%)
Find more stocks in the Stock Screener
TPH Latest News and Analysis
 14 days ago - ChartmillTRI POINTE HOMES INC (NYSE:TPH), an undervalued stock with good fundamentals.
TRI POINTE HOMES INC may be an undervalued stock option. NYSE:TPH retains a strong financial foundation and an attractive price tag.
