In a market where value is scarce, TOLL BROTHERS INC (NYSE:TOL) offers a refreshing opportunity with its solid fundamentals.
By Mill Chart
Last update: Feb 28, 2025
Our stock screening tool has pinpointed TOLL BROTHERS INC (NYSE:TOL) as an undervalued stock. NYSE:TOL maintains a solid financial footing. Furthermore, it remains attractively priced. Let's delve into the specifics below.
Evaluating Valuation: NYSE:TOL
To assess a stock's valuation, ChartMill utilizes a Valuation Rating on a scale of 0 to 10. This comprehensive assessment considers various valuation aspects, comparing price to earnings and cash flows, while factoring in profitability and growth. NYSE:TOL has achieved a 8 out of 10:
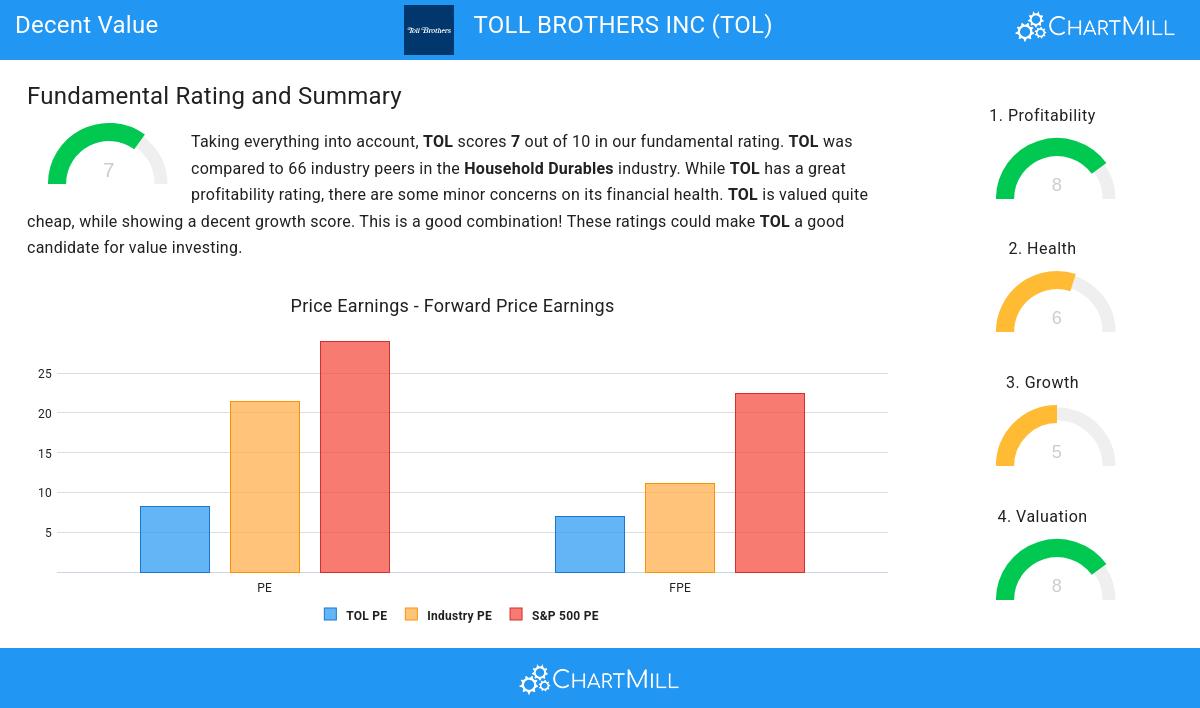
- The Price/Earnings ratio is 8.28, which indicates a very decent valuation of TOL.
- Based on the Price/Earnings ratio, TOL is valued a bit cheaper than 71.88% of the companies in the same industry.
- Compared to an average S&P500 Price/Earnings ratio of 29.01, TOL is valued rather cheaply.
- With a Price/Forward Earnings ratio of 6.94, the valuation of TOL can be described as very cheap.
- Based on the Price/Forward Earnings ratio, TOL is valued cheaply inside the industry as 84.38% of the companies are valued more expensively.
- TOL is valuated cheaply when we compare the Price/Forward Earnings ratio to 22.40, which is the current average of the S&P500 Index.
- Compared to the rest of the industry, the Enterprise Value to EBITDA ratio of TOL indicates a rather cheap valuation: TOL is cheaper than 81.25% of the companies listed in the same industry.
- Based on the Price/Free Cash Flow ratio, TOL is valued cheaper than 81.25% of the companies in the same industry.
- TOL has an outstanding profitability rating, which may justify a higher PE ratio.
A Closer Look at Profitability for NYSE:TOL
Discover ChartMill's exclusive Profitability Rating, a proprietary metric that assesses stocks on a scale of 0 to 10. It takes into consideration various profitability ratios and margins, both in absolute terms and relative to industry peers. Notably, NYSE:TOL has achieved a 8:
- With an excellent Return On Assets value of 11.75%, TOL belongs to the best of the industry, outperforming 84.38% of the companies in the same industry.
- TOL has a better Return On Equity (20.48%) than 84.38% of its industry peers.
- The Return On Invested Capital of TOL (14.49%) is better than 79.69% of its industry peers.
- The 3 year average ROIC (13.26%) for TOL is below the current ROIC(14.49%), indicating increased profibility in the last year.
- TOL has a Profit Margin of 14.49%. This is amongst the best in the industry. TOL outperforms 90.63% of its industry peers.
- TOL's Profit Margin has improved in the last couple of years.
- TOL has a better Operating Margin (18.85%) than 90.63% of its industry peers.
- In the last couple of years the Operating Margin of TOL has grown nicely.
- TOL's Gross Margin has improved in the last couple of years.
ChartMill's Evaluation of Health
ChartMill employs its own Health Rating for stock assessment. This rating, ranging from 0 to 10, is calculated by examining various liquidity and solvency ratios. In the case of NYSE:TOL, the assigned 6 reflects its health status:
- TOL has an Altman-Z score of 4.12. This indicates that TOL is financially healthy and has little risk of bankruptcy at the moment.
- TOL has a Altman-Z score of 4.12. This is in the better half of the industry: TOL outperforms 64.06% of its industry peers.
- The Debt to FCF ratio of TOL is 3.02, which is a good value as it means it would take TOL, 3.02 years of fcf income to pay off all of its debts.
- TOL has a Debt to FCF ratio of 3.02. This is in the better half of the industry: TOL outperforms 67.19% of its industry peers.
- TOL has a Debt/Equity ratio of 0.37. This is a healthy value indicating a solid balance between debt and equity.
- A Current Ratio of 4.05 indicates that TOL has no problem at all paying its short term obligations.
- Looking at the Current ratio, with a value of 4.05, TOL is in the better half of the industry, outperforming 70.31% of the companies in the same industry.
Growth Analysis for NYSE:TOL
ChartMill assigns a proprietary Growth Rating to each stock. The score is computed by evaluating various growth aspects, like EPS and revenue growth. We take into account the history as well as the estimated future numbers. NYSE:TOL was assigned a score of 5 for growth:
- Measured over the past years, TOL shows a very strong growth in Earnings Per Share. The EPS has been growing by 27.96% on average per year.
- Measured over the past years, TOL shows a quite strong growth in Revenue. The Revenue has been growing by 8.47% on average per year.
- TOL is expected to show quite a strong growth in Earnings Per Share. In the coming years, the EPS will grow by 8.33% yearly.
Every day, new Decent Value stocks can be found on ChartMill in our Decent Value screener.
For an up to date full fundamental analysis you can check the fundamental report of TOL
Keep in mind
This is not investing advice! The article highlights some of the observations at the time of writing, but you should always make your own analysis and invest based on your own insights.
100.08
-0.98 (-0.97%)
Find more stocks in the Stock Screener
TOL Latest News and Analysis
 3 days ago - ChartmillTOLL BROTHERS INC (NYSE:TOL) is an undervalued gem with solid fundamentals.
TOLL BROTHERS INC is a hidden gem, featuring undervaluation and robust fundamentals. NYSE:TOL showcases decent financial health and profitability, coupled with an attractive price.
 12 days ago - ChartmillHow does TOLL BROTHERS INC (NYSE:TOL) stack up against Peter Lynch’s investment principles?
Peter Lynch’s investment philosophy combines fundamental analysis with a deep understanding of business models. Let’s analyze if TOLL BROTHERS INC (NYSE:TOL) meets his criteria for a solid investment.
