NYSE:TOL is probably undervalued for the fundamentals it is displaying.
By Mill Chart
Last update: Oct 17, 2024
TOLL BROTHERS INC (NYSE:TOL) has caught the attention of our stock screener as a great value stock. NYSE:TOL excels in profitability, solvency, and liquidity, all while being very reasonably priced. Let's delve into the details.
A Closer Look at Valuation for NYSE:TOL
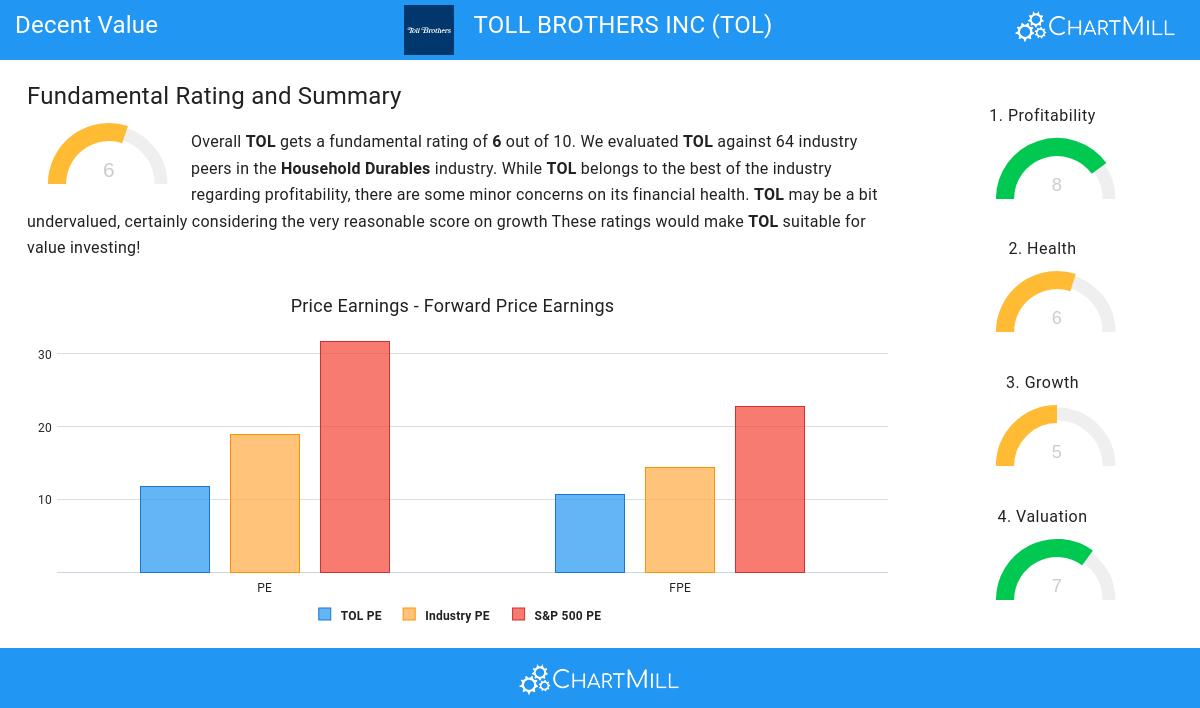
ChartMill assigns a Valuation Rating to every stock. This score ranges from 0 to 10 and evaluates the different valuation aspects and compares the price to earnings and cash flows, while taking into account profitability and growth. NYSE:TOL scores a 7 out of 10:
- The Price/Earnings ratio is 11.81, which indicates a very decent valuation of TOL.
- 67.74% of the companies in the same industry are more expensive than TOL, based on the Price/Earnings ratio.
- TOL's Price/Earnings ratio indicates a rather cheap valuation when compared to the S&P500 average which is at 31.76.
- With a Price/Forward Earnings ratio of 10.66, the valuation of TOL can be described as very reasonable.
- 67.74% of the companies in the same industry are more expensive than TOL, based on the Price/Forward Earnings ratio.
- The average S&P500 Price/Forward Earnings ratio is at 22.74. TOL is valued rather cheaply when compared to this.
- Compared to the rest of the industry, the Enterprise Value to EBITDA ratio of TOL indicates a somewhat cheap valuation: TOL is cheaper than 70.97% of the companies listed in the same industry.
- TOL's Price/Free Cash Flow ratio is a bit cheaper when compared to the industry. TOL is cheaper than 67.74% of the companies in the same industry.
- The low PEG Ratio(NY), which compensates the Price/Earnings for growth, indicates a rather cheap valuation of the company.
- The excellent profitability rating of TOL may justify a higher PE ratio.
What does the Profitability looks like for NYSE:TOL
ChartMill assigns a proprietary Profitability Rating to each stock. The score is computed by evaluating various profitability ratios and margins and ranges from 0 to 10. NYSE:TOL was assigned a score of 8 for profitability:
- TOL's Return On Assets of 11.54% is amongst the best of the industry. TOL outperforms 82.26% of its industry peers.
- Looking at the Return On Equity, with a value of 20.79%, TOL belongs to the top of the industry, outperforming 80.65% of the companies in the same industry.
- TOL has a better Return On Invested Capital (14.50%) than 79.03% of its industry peers.
- The last Return On Invested Capital (14.50%) for TOL is above the 3 year average (11.30%), which is a sign of increasing profitability.
- With an excellent Profit Margin value of 14.63%, TOL belongs to the best of the industry, outperforming 90.32% of the companies in the same industry.
- TOL's Profit Margin has improved in the last couple of years.
- The Operating Margin of TOL (18.91%) is better than 91.94% of its industry peers.
- In the last couple of years the Operating Margin of TOL has grown nicely.
- In the last couple of years the Gross Margin of TOL has grown nicely.
What does the Health looks like for NYSE:TOL
To gauge a stock's financial health, ChartMill utilizes a Health Rating on a scale of 0 to 10. This comprehensive evaluation encompasses liquidity and solvency, both in absolute terms and in comparison to industry peers. NYSE:TOL has earned a 6 out of 10:
- An Altman-Z score of 4.44 indicates that TOL is not in any danger for bankruptcy at the moment.
- TOL has a Altman-Z score of 4.44. This is in the better half of the industry: TOL outperforms 66.13% of its industry peers.
- The Debt to FCF ratio of TOL is 3.34, which is a good value as it means it would take TOL, 3.34 years of fcf income to pay off all of its debts.
- TOL's Debt to FCF ratio of 3.34 is fine compared to the rest of the industry. TOL outperforms 66.13% of its industry peers.
- A Debt/Equity ratio of 0.38 indicates that TOL is not too dependend on debt financing.
- A Current Ratio of 3.72 indicates that TOL has no problem at all paying its short term obligations.
- TOL has a better Current ratio (3.72) than 64.52% of its industry peers.
Assessing Growth Metrics for NYSE:TOL
ChartMill employs its own Growth Rating system for all stocks. This score, ranging from 0 to 10, is derived by evaluating different growth factors, such as EPS and revenue growth, taking into account both past performance and future projections. NYSE:TOL has earned a 5 for growth:
- The Earnings Per Share has been growing by 21.45% on average over the past years. This is a very strong growth
- Based on estimates for the next years, TOL will show a quite strong growth in Earnings Per Share. The EPS will grow by 9.21% on average per year.
- The Revenue is expected to grow by 8.32% on average over the next years. This is quite good.
More Decent Value stocks can be found in our Decent Value screener.
For an up to date full fundamental analysis you can check the fundamental report of TOL
Keep in mind
This article should in no way be interpreted as advice. The article is based on the observed metrics at the time of writing, but you should always make your own analysis and trade or invest at your own responsibility.
101.06
+2.87 (+2.92%)
Find more stocks in the Stock Screener
TOL Latest News and Analysis
 16 minutes ago - ChartmillTOLL BROTHERS INC (NYSE:TOL) is an undervalued gem with solid fundamentals.
TOLL BROTHERS INC is a hidden gem, featuring undervaluation and robust fundamentals. NYSE:TOL showcases decent financial health and profitability, coupled with an attractive price.
 9 days ago - ChartmillHow does TOLL BROTHERS INC (NYSE:TOL) stack up against Peter Lynch’s investment principles?
Peter Lynch’s investment philosophy combines fundamental analysis with a deep understanding of business models. Let’s analyze if TOLL BROTHERS INC (NYSE:TOL) meets his criteria for a solid investment.
