
NYSE:TNL stands out as a stock that provides good value for the fundamentals it showcases.
By Mill Chart
Last update: Feb 26, 2025
Our stock screening tool has identified TRAVEL + LEISURE CO (NYSE:TNL) as an undervalued gem with strong fundamentals. NYSE:TNL boasts decent financial health and profitability while maintaining an attractive price point. We'll break it down further.
Valuation Examination for NYSE:TNL
An integral part of ChartMill's stock analysis is the Valuation Rating, which spans from 0 to 10. This rating evaluates diverse valuation factors, including price to earnings and cash flows, while considering the stock's profitability and growth. NYSE:TNL has received a 8 out of 10:
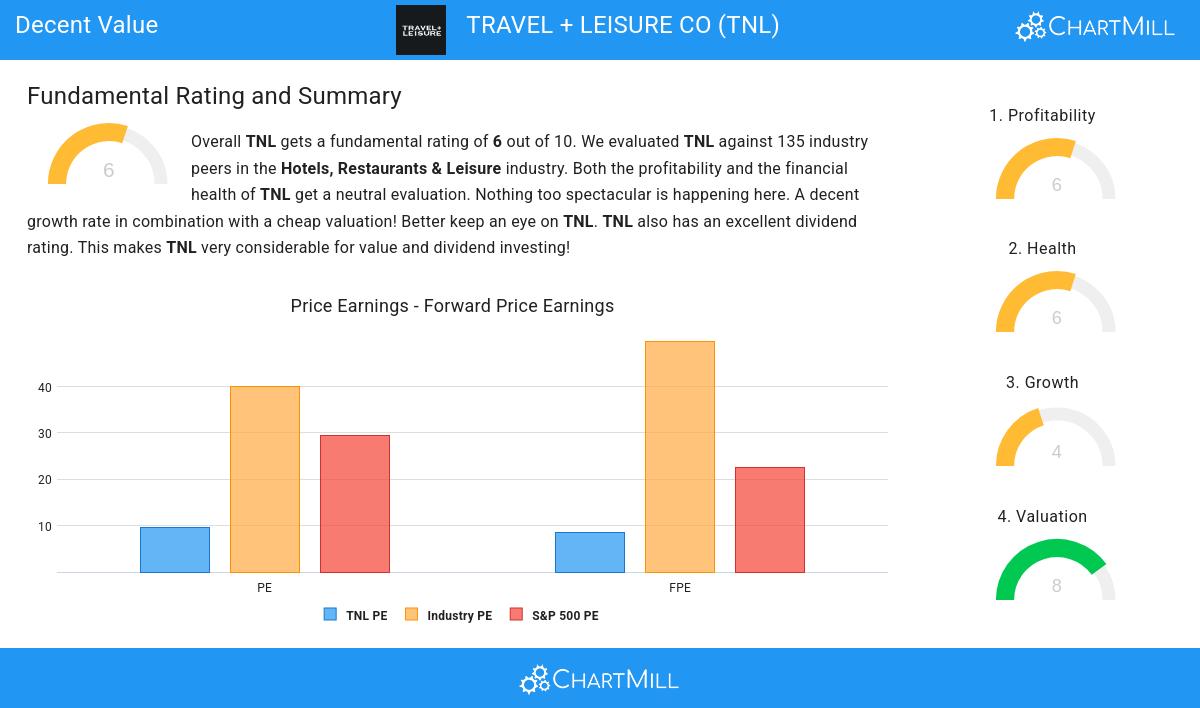
- With a Price/Earnings ratio of 9.66, the valuation of TNL can be described as very reasonable.
- Compared to the rest of the industry, the Price/Earnings ratio of TNL indicates a rather cheap valuation: TNL is cheaper than 95.42% of the companies listed in the same industry.
- Compared to an average S&P500 Price/Earnings ratio of 29.43, TNL is valued rather cheaply.
- Based on the Price/Forward Earnings ratio of 8.60, the valuation of TNL can be described as reasonable.
- TNL's Price/Forward Earnings ratio is rather cheap when compared to the industry. TNL is cheaper than 95.42% of the companies in the same industry.
- TNL's Price/Forward Earnings ratio indicates a rather cheap valuation when compared to the S&P500 average which is at 22.65.
- Compared to the rest of the industry, the Enterprise Value to EBITDA ratio of TNL indicates a somewhat cheap valuation: TNL is cheaper than 64.89% of the companies listed in the same industry.
- TNL's Price/Free Cash Flow ratio is rather cheap when compared to the industry. TNL is cheaper than 93.13% of the companies in the same industry.
- TNL's low PEG Ratio(NY), which compensates the Price/Earnings for growth, indicates a rather cheap valuation of the company.
- TNL has a very decent profitability rating, which may justify a higher PE ratio.
- A more expensive valuation may be justified as TNL's earnings are expected to grow with 15.35% in the coming years.
Exploring NYSE:TNL's Profitability
Discover ChartMill's exclusive Profitability Rating, a proprietary metric that assesses stocks on a scale of 0 to 10. It takes into consideration various profitability ratios and margins, both in absolute terms and relative to industry peers. Notably, NYSE:TNL has achieved a 6:
- TNL has a Return On Assets of 6.10%. This is in the better half of the industry: TNL outperforms 76.34% of its industry peers.
- With a decent Return On Invested Capital value of 10.54%, TNL is doing good in the industry, outperforming 73.28% of the companies in the same industry.
- The 3 year average ROIC (10.16%) for TNL is below the current ROIC(10.54%), indicating increased profibility in the last year.
- TNL has a Profit Margin of 10.63%. This is in the better half of the industry: TNL outperforms 75.57% of its industry peers.
- The Operating Margin of TNL (19.48%) is better than 76.34% of its industry peers.
Health Analysis for NYSE:TNL
ChartMill employs a unique Health Rating system for all stocks. This rating, ranging from 0 to 10, is determined by analyzing various liquidity and solvency ratios. For NYSE:TNL, the assigned 6 for health provides valuable insights:
- TNL's Altman-Z score of 2.32 is fine compared to the rest of the industry. TNL outperforms 64.89% of its industry peers.
- A Current Ratio of 3.72 indicates that TNL has no problem at all paying its short term obligations.
- With an excellent Current ratio value of 3.72, TNL belongs to the best of the industry, outperforming 96.95% of the companies in the same industry.
- TNL has a Quick Ratio of 2.71. This indicates that TNL is financially healthy and has no problem in meeting its short term obligations.
- Looking at the Quick ratio, with a value of 2.71, TNL belongs to the top of the industry, outperforming 93.89% of the companies in the same industry.
Assessing Growth for NYSE:TNL
To evaluate a stock's growth potential, ChartMill utilizes a Growth Rating on a scale of 0 to 10. This comprehensive assessment considers various growth aspects, including historical and estimated EPS and revenue growth. NYSE:TNL has achieved a 4 out of 10:
- TNL is expected to show quite a strong growth in Earnings Per Share. In the coming years, the EPS will grow by 15.35% yearly.
- When comparing the EPS growth rate of the last years to the growth rate of the upcoming years, we see that the growth is accelerating.
- The Revenue growth rate is accelerating: in the next years the growth will be better than in the last years.
Our Decent Value screener lists more Decent Value stocks and is updated daily.
Our latest full fundamental report of TNL contains the most current fundamental analsysis.
Disclaimer
This is not investing advice! The article highlights some of the observations at the time of writing, but you should always make your own analysis and invest based on your own insights.
41.42
+0.41 (+1%)
Find more stocks in the Stock Screener
TNL Latest News and Analysis
 13 days ago - ChartmillIs TRAVEL + LEISURE CO (NYSE:TNL) a Good Fit for Dividend Investing?
Why TRAVEL + LEISURE CO (NYSE:TNL) provides a good dividend, while having solid fundamentals.
