
Our stock screening tool has identified TRAVEL + LEISURE CO (NYSE:TNL) as an undervalued gem with strong fundamentals. NYSE:TNL boasts decent financial health and profitability while maintaining an attractive price point. We'll break it down further.
How We Gauge Valuation for NYSE:TNL
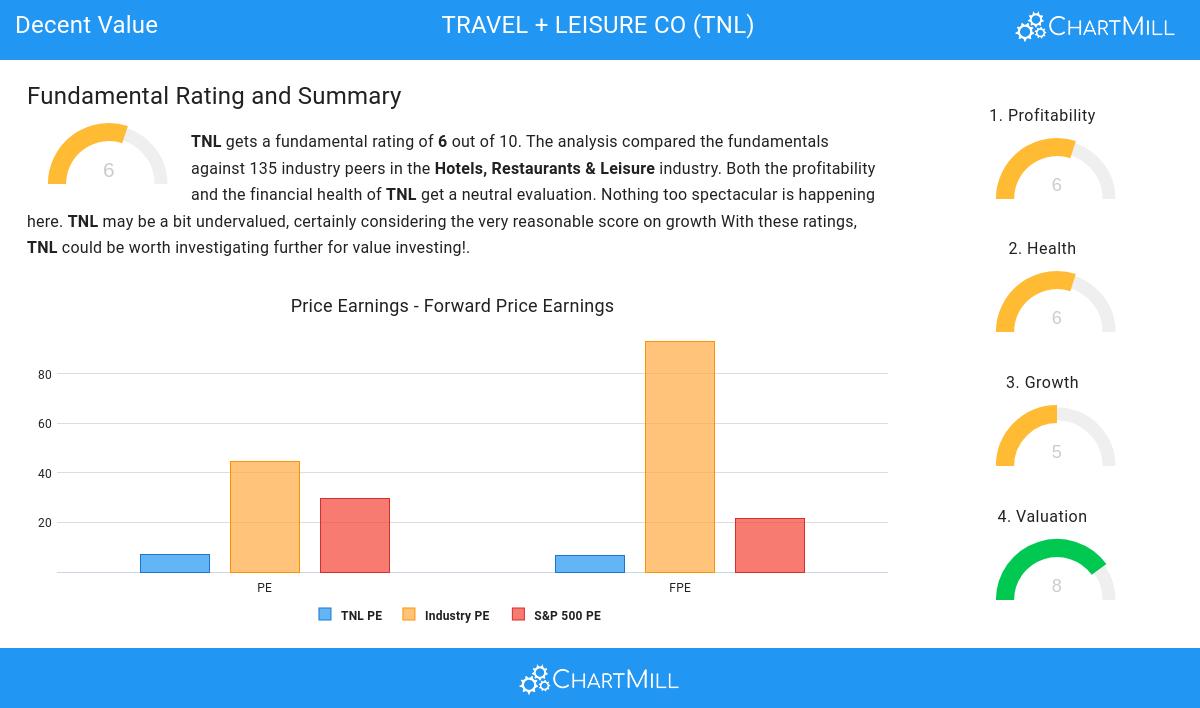
To assess a stock's valuation, ChartMill utilizes a Valuation Rating on a scale of 0 to 10. This comprehensive assessment considers various valuation aspects, comparing price to earnings and cash flows, while factoring in profitability and growth. NYSE:TNL has achieved a 8 out of 10:
- Based on the Price/Earnings ratio of 7.10, the valuation of TNL can be described as very cheap.
- Based on the Price/Earnings ratio, TNL is valued cheaper than 97.04% of the companies in the same industry.
- The average S&P500 Price/Earnings ratio is at 29.65. TNL is valued rather cheaply when compared to this.
- With a Price/Forward Earnings ratio of 6.65, the valuation of TNL can be described as very cheap.
- Compared to the rest of the industry, the Price/Forward Earnings ratio of TNL indicates a rather cheap valuation: TNL is cheaper than 97.78% of the companies listed in the same industry.
- The average S&P500 Price/Forward Earnings ratio is at 21.38. TNL is valued rather cheaply when compared to this.
- TNL's Enterprise Value to EBITDA ratio is a bit cheaper when compared to the industry. TNL is cheaper than 60.74% of the companies in the same industry.
- 91.85% of the companies in the same industry are more expensive than TNL, based on the Price/Free Cash Flow ratio.
- TNL has a very decent profitability rating, which may justify a higher PE ratio.
Profitability Examination for NYSE:TNL
ChartMill's Profitability Rating offers a unique perspective on stock analysis, providing scores from 0 to 10. These ratings consider a wide range of profitability metrics and margins, both in comparison to industry peers and on their own merits. For NYSE:TNL, the assigned 6 is a significant indicator of profitability:
- Looking at the Return On Assets, with a value of 6.48%, TNL is in the better half of the industry, outperforming 77.04% of the companies in the same industry.
- The Return On Invested Capital of TNL (10.57%) is better than 73.33% of its industry peers.
- The last Return On Invested Capital (10.57%) for TNL is above the 3 year average (9.59%), which is a sign of increasing profitability.
- TNL's Profit Margin of 11.35% is fine compared to the rest of the industry. TNL outperforms 77.04% of its industry peers.
- The Operating Margin of TNL (19.72%) is better than 78.52% of its industry peers.
How do we evaluate the Health for NYSE:TNL?
ChartMill employs a unique Health Rating system for all stocks. This rating, ranging from 0 to 10, is determined by analyzing various liquidity and solvency ratios. For NYSE:TNL, the assigned 6 for health provides valuable insights:
- With a decent Altman-Z score value of 2.23, TNL is doing good in the industry, outperforming 65.93% of the companies in the same industry.
- A Current Ratio of 3.75 indicates that TNL has no problem at all paying its short term obligations.
- The Current ratio of TNL (3.75) is better than 97.78% of its industry peers.
- TNL has a Quick Ratio of 2.75. This indicates that TNL is financially healthy and has no problem in meeting its short term obligations.
- TNL's Quick ratio of 2.75 is amongst the best of the industry. TNL outperforms 94.81% of its industry peers.
ChartMill's Evaluation of Growth
ChartMill assigns a proprietary Growth Rating to each stock. The score is computed by evaluating various growth aspects, like EPS and revenue growth. We take into account the history as well as the estimated future numbers. NYSE:TNL was assigned a score of 5 for growth:
- The Earnings Per Share has grown by an impressive 25.21% over the past year.
- TNL is expected to show quite a strong growth in Earnings Per Share. In the coming years, the EPS will grow by 9.22% yearly.
- The EPS growth rate is accelerating: in the next years the growth will be better than in the last years.
- The Revenue growth rate is accelerating: in the next years the growth will be better than in the last years.
More Decent Value stocks can be found in our Decent Value screener.
Check the latest full fundamental report of TNL for a complete fundamental analysis.
Keep in mind
This article should in no way be interpreted as advice. The article is based on the observed metrics at the time of writing, but you should always make your own analysis and trade or invest at your own responsibility.