
Good technical signals and a possible breakout for TJX COMPANIES INC.
By Mill Chart
Last update: Feb 5, 2025
Our stock screener has flagged TJX COMPANIES INC (NYSE:TJX) as a potential breakout candidate. This occurs when the stock shows signs of consolidation after a notable upward trend. While we can't predict the actual breakout, it's worth monitoring NYSE:TJX for potential movement.
Zooming in on the technicals.
At ChartMill, a crucial aspect of their analysis is the assignment of a Technical Rating to each stock. This rating, ranging from 0 to 10, is calculated daily by considering numerous technical indicators and properties.
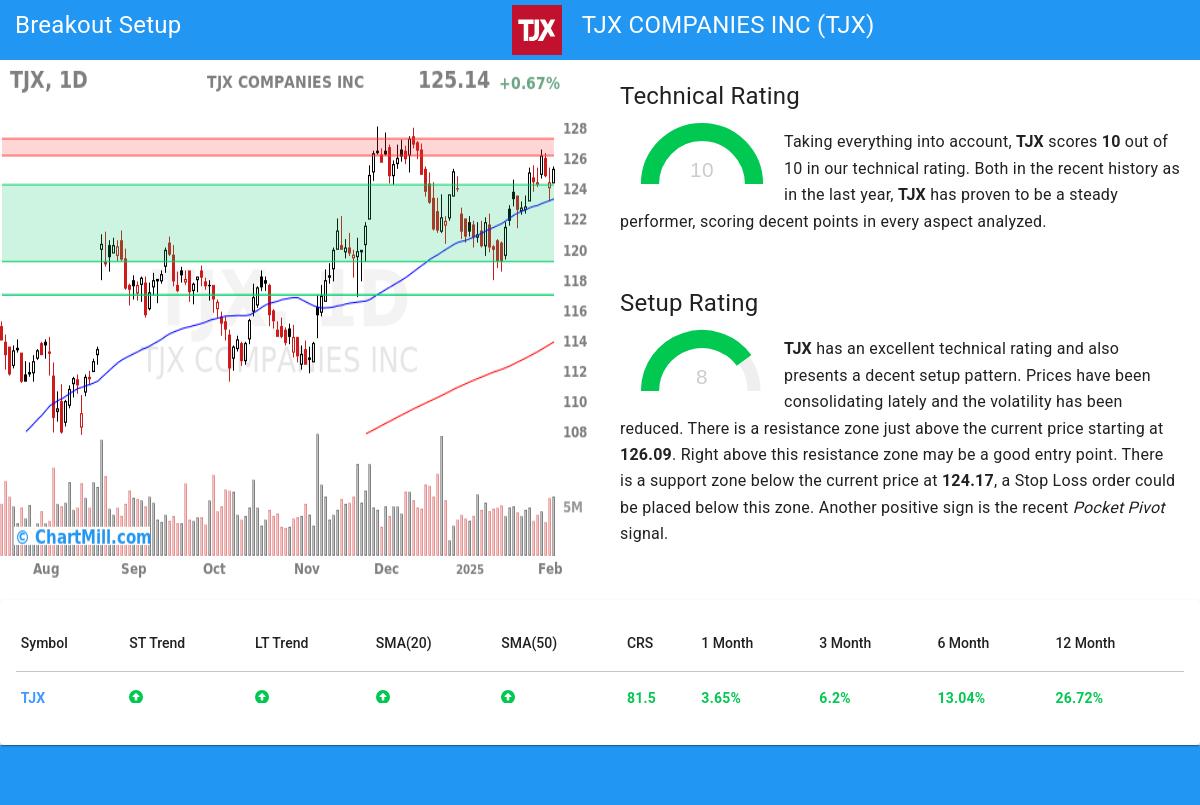
Overall TJX gets a technical rating of 10 out of 10. Both in the recent history as in the last year, TJX has proven to be a steady performer, scoring decent points in every aspect analyzed.
- The long and short term trends are both positive. This is looking good!
- When comparing the yearly performance of all stocks, we notice that TJX is one of the better performing stocks in the market, outperforming 81% of all stocks. On top of that, TJX also shows a nice and consistent pattern of rising prices.
- TJX is currently trading near its 52 week high, which is a good sign. The S&P500 Index however is also trading near new highs, which makes the performance in line with the market.
- In the last month TJX has a been trading in the 117.89 - 126.48 range, which is quite wide. It is currently trading near the high of this range.
- TJX is an average performer in the Specialty Retail industry, it outperforms 69% of 120 stocks in the same industry.
For an up to date full technical analysis you can check the technical report of TJX
How do we evaluate the setup for NYSE:TJX?
Besides the Technical Rating, ChartMill also assign a Setup Rating to every stock. This setup score also ranges from 0 to 10 and determines to which extend the stock is consolidating. This is achieved by evaluating multiple short term technical indicators. NYSE:TJX currently has a 8 as setup rating:
Besides having an excellent technical rating, TJX also presents a decent setup pattern. Prices have been consolidating lately and the volatility has been reduced. There is a resistance zone just above the current price starting at 126.09. Right above this resistance zone may be a good entry point. There is a support zone below the current price at 124.17, a Stop Loss order could be placed below this zone. Another positive sign is the recent Pocket Pivot signal.
How can NYSE:TJX be traded?
One strategy to consider is waiting for the actual breakout to occur, where the stock breaks out above the current consolidation zone. Traders can then enter a buy position, anticipating further upward momentum. As a risk management measure, it is advisable to set a stop loss order below the consolidation zone.
Please note that this article should not be construed as trading advice. The information provided is solely based on automated technical analysis and serves to highlight technical observations. It is important to conduct your own analysis and make trading decisions based on your own judgment and responsibility.
Every day, new breakout setups can be found on ChartMill in our Breakout screener.
Disclaimer
Important Note: The content of this article is not intended as trading advice. It is essential to perform your own analysis and exercise caution when making trading decisions. The article presents observations created by automated analysis but does not guarantee any trading or investment outcomes. Always trade responsibly and make independent judgments.