Balancing Dividends and Fundamentals: The Case of NYSE:THO.
By Mill Chart
Last update: Oct 14, 2024
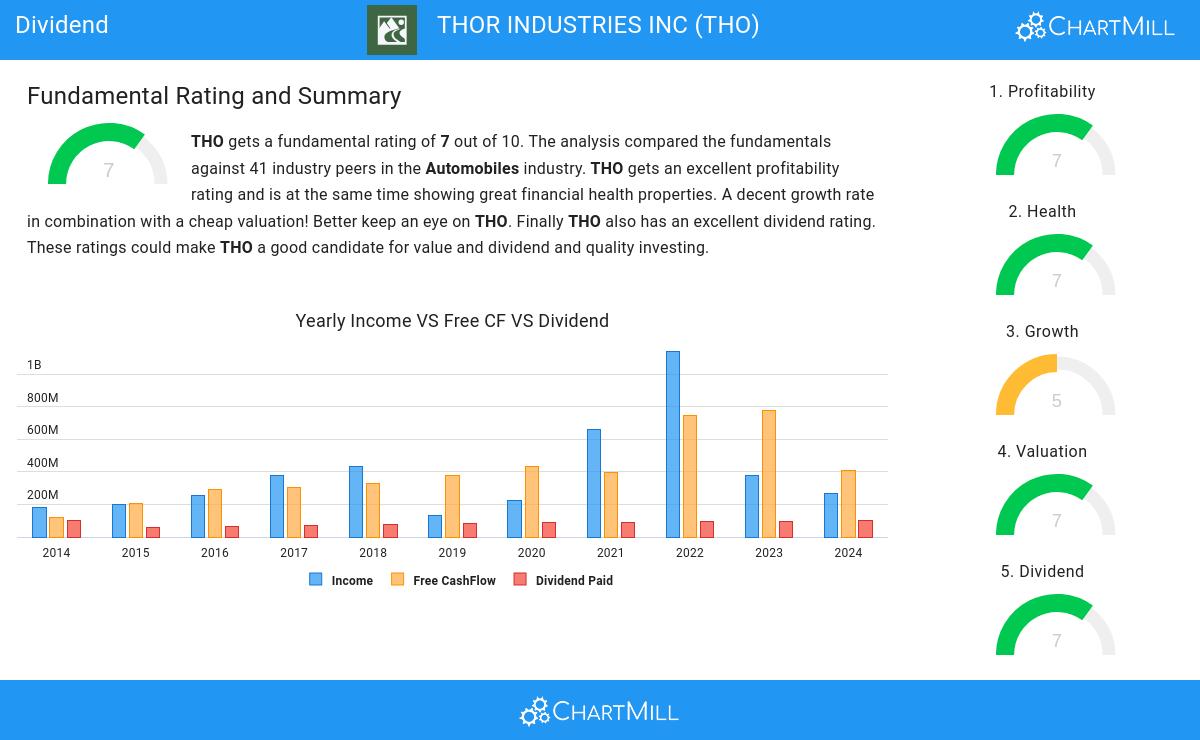
Our stock screening tool has identified THOR INDUSTRIES INC (NYSE:THO) as a strong dividend contender with robust fundamentals. NYSE:THO exhibits commendable financial health and profitability, all while offering a sustainable dividend. Let's delve into each aspect below.
A Closer Look at Dividend for NYSE:THO
ChartMill assigns a Dividend Rating to every stock. This score ranges from 0 to 10 and evaluates the different dividend aspects, including the yield, the growth and sustainability. NYSE:THO scores a 7 out of 10:
- Compared to an average industry Dividend Yield of 3.71, THO pays a better dividend. On top of this THO pays more dividend than 85.37% of the companies listed in the same industry.
- THO has been paying a dividend for at least 10 years, so it has a reliable track record.
- THO has not decreased its dividend for at least 10 years, so it has a reliable track record of non decreasing dividend.
- THO pays out 38.50% of its income as dividend. This is a sustainable payout ratio.
- THO's earnings are growing more than its dividend. This makes the dividend growth sustainable.
Unpacking NYSE:THO's Health Rating
A critical element of ChartMill's stock evaluation is the Health Rating, which spans from 0 to 10. This rating considers multiple health factors, including liquidity and solvency, both in absolute terms and relative to industry peers. NYSE:THO has received a 7 out of 10:
- THO has an Altman-Z score of 3.85. This indicates that THO is financially healthy and has little risk of bankruptcy at the moment.
- The Altman-Z score of THO (3.85) is better than 87.80% of its industry peers.
- The Debt to FCF ratio of THO is 2.98, which is a good value as it means it would take THO, 2.98 years of fcf income to pay off all of its debts.
- THO has a better Debt to FCF ratio (2.98) than 97.56% of its industry peers.
- THO has a Debt/Equity ratio of 0.29. This is a healthy value indicating a solid balance between debt and equity.
- THO has a Current ratio of 1.69. This is in the better half of the industry: THO outperforms 60.98% of its industry peers.
Profitability Examination for NYSE:THO
ChartMill's Profitability Rating offers a unique perspective on stock analysis, providing scores from 0 to 10. These ratings consider a wide range of profitability metrics and margins, both in comparison to industry peers and on their own merits. For NYSE:THO, the assigned 7 is a significant indicator of profitability:
- THO has a Return On Assets of 3.78%. This is in the better half of the industry: THO outperforms 75.61% of its industry peers.
- The Return On Equity of THO (6.52%) is better than 70.73% of its industry peers.
- THO's Return On Invested Capital of 5.91% is fine compared to the rest of the industry. THO outperforms 78.05% of its industry peers.
- The 3 year average ROIC (11.53%) for THO is well above the current ROIC(5.91%). The reason for the recent decline needs to be investigated.
- The Profit Margin of THO (2.64%) is better than 70.73% of its industry peers.
- In the last couple of years the Profit Margin of THO has grown nicely.
- With a decent Operating Margin value of 4.31%, THO is doing good in the industry, outperforming 73.17% of the companies in the same industry.
- THO has a better Gross Margin (14.46%) than 60.98% of its industry peers.
- In the last couple of years the Gross Margin of THO has grown nicely.
More Best Dividend stocks can be found in our Best Dividend screener.
For an up to date full fundamental analysis you can check the fundamental report of THO
Keep in mind
This article should in no way be interpreted as advice. The article is based on the observed metrics at the time of writing, but you should always make your own analysis and trade or invest at your own responsibility.
81.4
-13.83 (-14.52%)
Find more stocks in the Stock Screener
THO Latest News and Analysis
 15 days ago - ChartmillWhy the dividend investor may take a look at NYSE:THO.
Why THOR INDUSTRIES INC (NYSE:THO) is a Top Pick for Dividend Investors.
