
For those who appreciate value investing, NYSE:THO is a compelling option with its solid fundamentals.
By Mill Chart
Last update: Oct 9, 2024
Uncover the hidden value in THOR INDUSTRIES INC (NYSE:THO) as our stock screening tool recommends it as an undervalued choice. NYSE:THO maintains a robust financial position and offers an attractive pricing perspective. Let's dig deeper into the analysis.
Analyzing Valuation Metrics
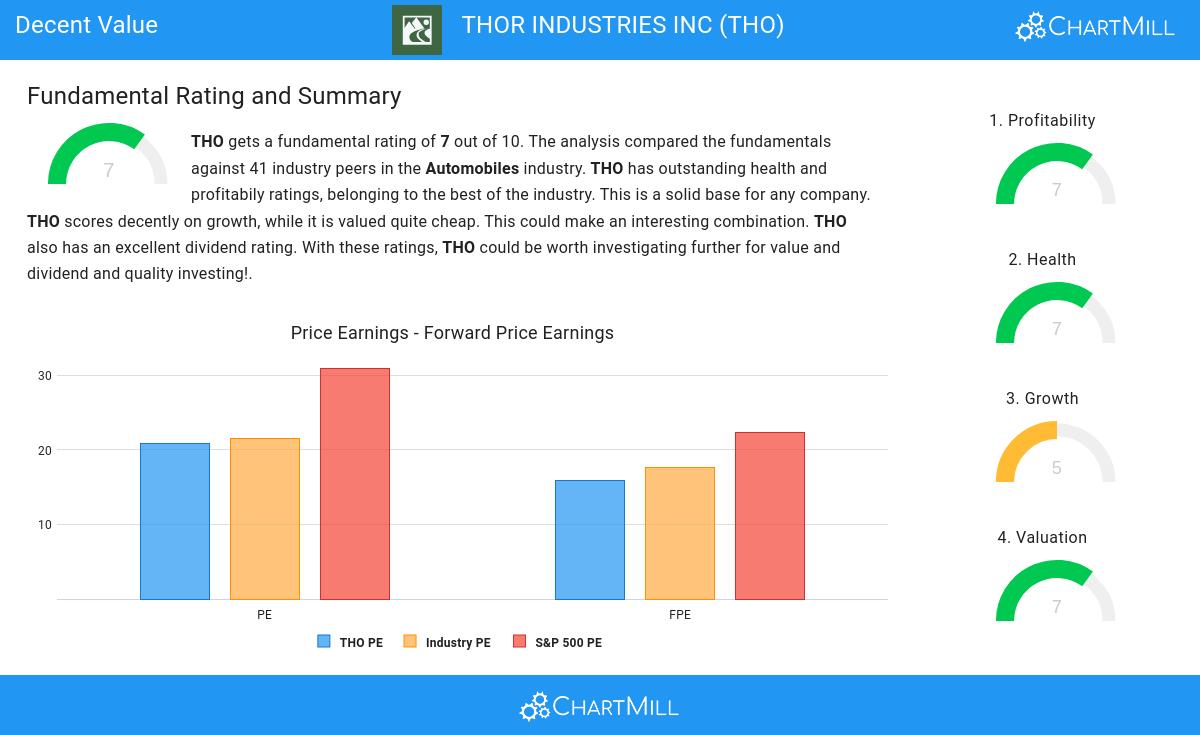
ChartMill assigns a proprietary Valuation Rating to each stock. The score is computed by evaluating various valuation aspects, like price to earnings and free cash flow, both absolutely as relative to the market and industry. NYSE:THO was assigned a score of 7 for valuation:
- Based on the Price/Earnings ratio, THO is valued a bit cheaper than 73.17% of the companies in the same industry.
- When comparing the Price/Earnings ratio of THO to the average of the S&P500 Index (30.97), we can say THO is valued slightly cheaper.
- THO's Price/Forward Earnings ratio is a bit cheaper when compared to the industry. THO is cheaper than 78.05% of the companies in the same industry.
- THO is valuated rather cheaply when we compare the Price/Forward Earnings ratio to 22.29, which is the current average of the S&P500 Index.
- Based on the Enterprise Value to EBITDA ratio, THO is valued cheaply inside the industry as 82.93% of the companies are valued more expensively.
- THO's Price/Free Cash Flow ratio is rather cheap when compared to the industry. THO is cheaper than 90.24% of the companies in the same industry.
- The low PEG Ratio(NY), which compensates the Price/Earnings for growth, indicates a rather cheap valuation of the company.
- THO has a very decent profitability rating, which may justify a higher PE ratio.
- THO's earnings are expected to grow with 33.93% in the coming years. This may justify a more expensive valuation.
What does the Profitability looks like for NYSE:THO
ChartMill's Profitability Rating offers a unique perspective on stock analysis, providing scores from 0 to 10. These ratings consider a wide range of profitability metrics and margins, both in comparison to industry peers and on their own merits. For NYSE:THO, the assigned 7 is a significant indicator of profitability:
- THO has a better Return On Assets (3.78%) than 75.61% of its industry peers.
- Looking at the Return On Equity, with a value of 6.52%, THO is in the better half of the industry, outperforming 70.73% of the companies in the same industry.
- THO has a Return On Invested Capital of 5.91%. This is in the better half of the industry: THO outperforms 78.05% of its industry peers.
- The 3 year average ROIC (11.53%) for THO is well above the current ROIC(5.91%). The reason for the recent decline needs to be investigated.
- The Profit Margin of THO (2.64%) is better than 70.73% of its industry peers.
- THO's Profit Margin has improved in the last couple of years.
- THO has a better Operating Margin (4.31%) than 73.17% of its industry peers.
- THO has a better Gross Margin (14.46%) than 60.98% of its industry peers.
- In the last couple of years the Gross Margin of THO has grown nicely.
Evaluating Health: NYSE:THO
ChartMill assigns a Health Rating to every stock. This score ranges from 0 to 10 and evaluates the different health aspects like liquidity and solvency, both absolutely, but also relative to the industry peers. NYSE:THO scores a 7 out of 10:
- An Altman-Z score of 3.83 indicates that THO is not in any danger for bankruptcy at the moment.
- THO has a better Altman-Z score (3.83) than 90.24% of its industry peers.
- THO has a debt to FCF ratio of 2.98. This is a good value and a sign of high solvency as THO would need 2.98 years to pay back of all of its debts.
- Looking at the Debt to FCF ratio, with a value of 2.98, THO belongs to the top of the industry, outperforming 97.56% of the companies in the same industry.
- A Debt/Equity ratio of 0.29 indicates that THO is not too dependend on debt financing.
- THO's Current ratio of 1.69 is fine compared to the rest of the industry. THO outperforms 60.98% of its industry peers.
Growth Examination for NYSE:THO
ChartMill assigns a proprietary Growth Rating to each stock. The score is computed by evaluating various growth aspects, like EPS and revenue growth. We take into account the history as well as the estimated future numbers. NYSE:THO was assigned a score of 5 for growth:
- Based on estimates for the next years, THO will show a very strong growth in Earnings Per Share. The EPS will grow by 30.35% on average per year.
- The Revenue is expected to grow by 10.38% on average over the next years. This is quite good.
- When comparing the EPS growth rate of the last years to the growth rate of the upcoming years, we see that the growth is accelerating.
- The Revenue growth rate is accelerating: in the next years the growth will be better than in the last years.
Every day, new Decent Value stocks can be found on ChartMill in our Decent Value screener.
Check the latest full fundamental report of THO for a complete fundamental analysis.
Disclaimer
Important Note: The content of this article is not intended as trading advice. It is essential to perform your own analysis and exercise caution when making trading decisions. The article presents observations created by automated analysis but does not guarantee any trading or investment outcomes. Always trade responsibly and make independent judgments.