
Discover THOR INDUSTRIES INC (NYSE:THO)—a stock that our stock screener has recognized as a solid dividend pick with strong fundamentals. NYSE:THO showcases decent financial health and profitability while providing a sustainable dividend. We'll explore the specifics further.
Evaluating Dividend: NYSE:THO
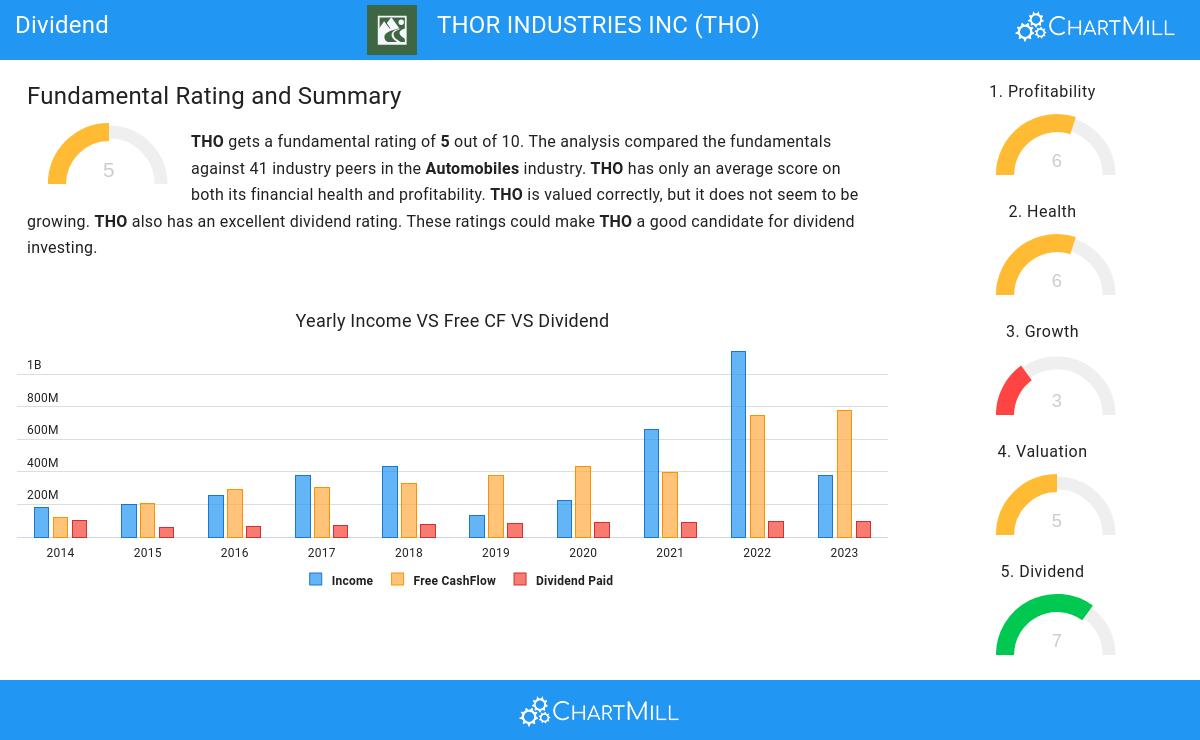
ChartMill assigns a proprietary Dividend Rating to each stock. The score is computed by evaluating various valuation aspects, like the yield, the history, the dividend growth and sustainability. NYSE:THO was assigned a score of 7 for dividend:
- THO's Dividend Yield is rather good when compared to the industry average which is at 3.47. THO pays more dividend than 87.80% of the companies in the same industry.
- THO has been paying a dividend for at least 10 years, so it has a reliable track record.
- THO has not decreased their dividend for at least 10 years, which is a reliable track record.
- 37.92% of the earnings are spent on dividend by THO. This is a low number and sustainable payout ratio.
- THO's earnings are growing more than its dividend. This makes the dividend growth sustainable.
What does the Health looks like for NYSE:THO
ChartMill employs a unique Health Rating system for all stocks. This rating, ranging from 0 to 10, is determined by analyzing various liquidity and solvency ratios. For NYSE:THO, the assigned 6 for health provides valuable insights:
- An Altman-Z score of 3.65 indicates that THO is not in any danger for bankruptcy at the moment.
- THO has a Altman-Z score of 3.65. This is amongst the best in the industry. THO outperforms 87.80% of its industry peers.
- The Debt to FCF ratio of THO is 2.39, which is a good value as it means it would take THO, 2.39 years of fcf income to pay off all of its debts.
- THO has a better Debt to FCF ratio (2.39) than 100.00% of its industry peers.
- THO has a Debt/Equity ratio of 0.32. This is a healthy value indicating a solid balance between debt and equity.
- THO's Current ratio of 1.65 is fine compared to the rest of the industry. THO outperforms 60.98% of its industry peers.
Exploring NYSE:THO's Profitability
Discover ChartMill's exclusive Profitability Rating, a proprietary metric that assesses stocks on a scale of 0 to 10. It takes into consideration various profitability ratios and margins, both in absolute terms and relative to industry peers. Notably, NYSE:THO has achieved a 6:
- The Return On Assets of THO (3.68%) is better than 75.61% of its industry peers.
- Looking at the Return On Equity, with a value of 6.63%, THO is in the better half of the industry, outperforming 70.73% of the companies in the same industry.
- THO's Return On Invested Capital of 6.09% is fine compared to the rest of the industry. THO outperforms 78.05% of its industry peers.
- THO had an Average Return On Invested Capital over the past 3 years of 14.58%. This is above the industry average of 10.91%.
- The last Return On Invested Capital (6.09%) for THO is well below the 3 year average (14.58%), which needs to be investigated, but indicates that THO had better years and this may not be a problem.
- The Profit Margin of THO (2.59%) is better than 70.73% of its industry peers.
- The Operating Margin of THO (4.31%) is better than 73.17% of its industry peers.
More Best Dividend stocks can be found in our Best Dividend screener.
Check the latest full fundamental report of THO for a complete fundamental analysis.
Disclaimer
Important Note: The content of this article is not intended as trading advice. It is essential to perform your own analysis and exercise caution when making trading decisions. The article presents observations created by automated analysis but does not guarantee any trading or investment outcomes. Always trade responsibly and make independent judgments.