Why the dividend investor may take a look at NYSE:TGNA.
By Mill Chart
Last update: Oct 3, 2024
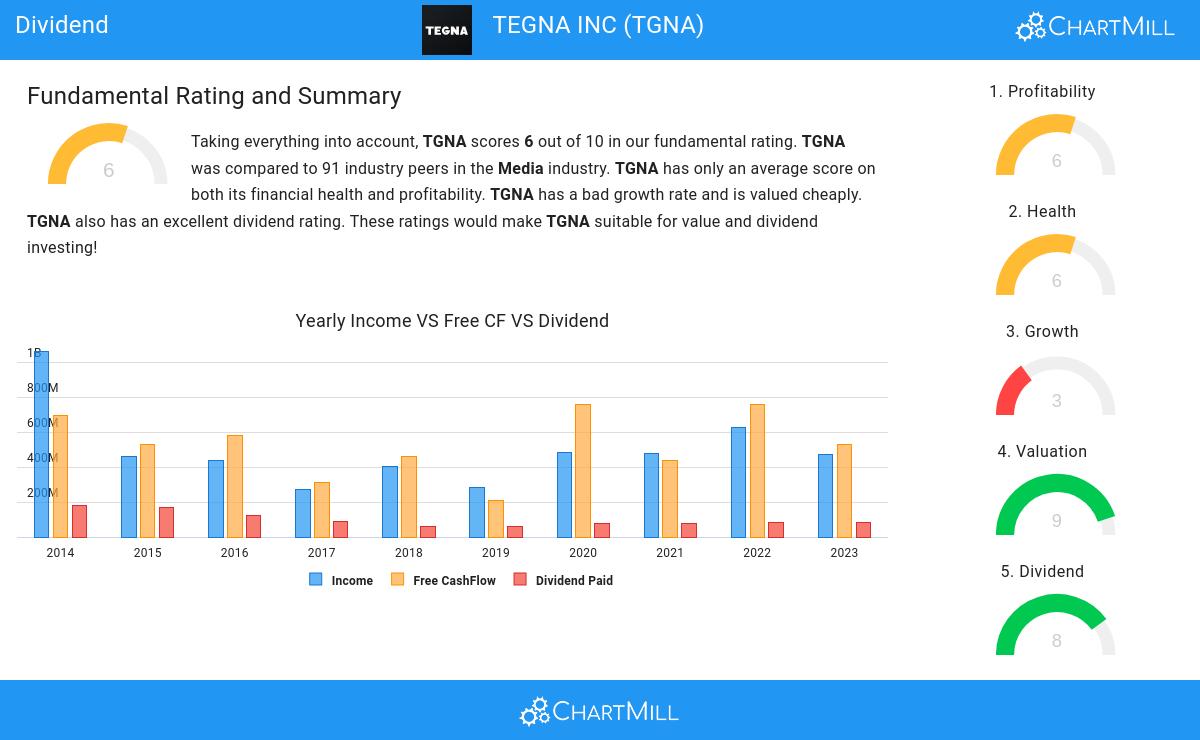
TEGNA INC (NYSE:TGNA) is a hidden gem unveiled by our stock screening tool, featuring a promising dividend outlook alongside solid fundamentals. NYSE:TGNA demonstrates decent financial health and profitability while ensuring a sustainable dividend. Let's break it down further.
Dividend Insights: NYSE:TGNA
An integral part of ChartMill's stock analysis is the Dividend Rating, which spans from 0 to 10. This rating evaluates diverse dividend factors, including yield, historical data, growth, and sustainability. NYSE:TGNA has received a 8 out of 10:
- TGNA's Dividend Yield is rather good when compared to the industry average which is at 4.21. TGNA pays more dividend than 84.27% of the companies in the same industry.
- TGNA's Dividend Yield is a higher than the S&P500 average which is at 2.20.
- The dividend of TGNA is nicely growing with an annual growth rate of 8.19%!
- TGNA has been paying a dividend for at least 10 years, so it has a reliable track record.
- As TGNA did not decrease their dividend in the past 5 years, we can say the dividend looks stable.
- 18.99% of the earnings are spent on dividend by TGNA. This is a low number and sustainable payout ratio.
- TGNA's earnings are growing more than its dividend. This makes the dividend growth sustainable.
Health Analysis for NYSE:TGNA
To gauge a stock's financial health, ChartMill utilizes a Health Rating on a scale of 0 to 10. This comprehensive evaluation encompasses liquidity and solvency, both in absolute terms and in comparison to industry peers. NYSE:TGNA has earned a 6 out of 10:
- TGNA has a better Altman-Z score (2.77) than 84.27% of its industry peers.
- Looking at the Debt to FCF ratio, with a value of 7.84, TGNA is in the better half of the industry, outperforming 64.04% of the companies in the same industry.
- A Current Ratio of 2.58 indicates that TGNA has no problem at all paying its short term obligations.
- TGNA's Current ratio of 2.58 is amongst the best of the industry. TGNA outperforms 80.90% of its industry peers.
- A Quick Ratio of 2.58 indicates that TGNA has no problem at all paying its short term obligations.
- TGNA's Quick ratio of 2.58 is amongst the best of the industry. TGNA outperforms 82.02% of its industry peers.
Evaluating Profitability: NYSE:TGNA
ChartMill assigns a proprietary Profitability Rating to each stock. The score is computed by evaluating various profitability ratios and margins and ranges from 0 to 10. NYSE:TGNA was assigned a score of 6 for profitability:
- The Return On Assets of TGNA (6.24%) is better than 86.52% of its industry peers.
- TGNA has a better Return On Equity (15.78%) than 86.52% of its industry peers.
- Looking at the Return On Invested Capital, with a value of 6.50%, TGNA is in the better half of the industry, outperforming 73.03% of the companies in the same industry.
- TGNA's Profit Margin of 15.44% is amongst the best of the industry. TGNA outperforms 92.13% of its industry peers.
- TGNA's Operating Margin of 19.60% is amongst the best of the industry. TGNA outperforms 93.26% of its industry peers.
Our Best Dividend screener lists more Best Dividend stocks and is updated daily.
Check the latest full fundamental report of TGNA for a complete fundamental analysis.
Disclaimer
Important Note: The content of this article is not intended as trading advice. It is essential to perform your own analysis and exercise caution when making trading decisions. The article presents observations created by automated analysis but does not guarantee any trading or investment outcomes. Always trade responsibly and make independent judgments.
17.8
+0.16 (+0.91%)
Find more stocks in the Stock Screener
TGNA Latest News and Analysis
 2 days ago - ChartmillWhy the dividend investor may take a look at TEGNA INC (NYSE:TGNA).
Why TEGNA INC (NYSE:TGNA) qualifies as a good dividend investing stock.
