
TEGNA INC (NYSE:TGNA) has caught the attention of dividend investors as a stock worth considering. NYSE:TGNA excels in profitability, solvency, and liquidity, all while providing a decent dividend. Let's delve into the details.
Understanding NYSE:TGNA's Dividend
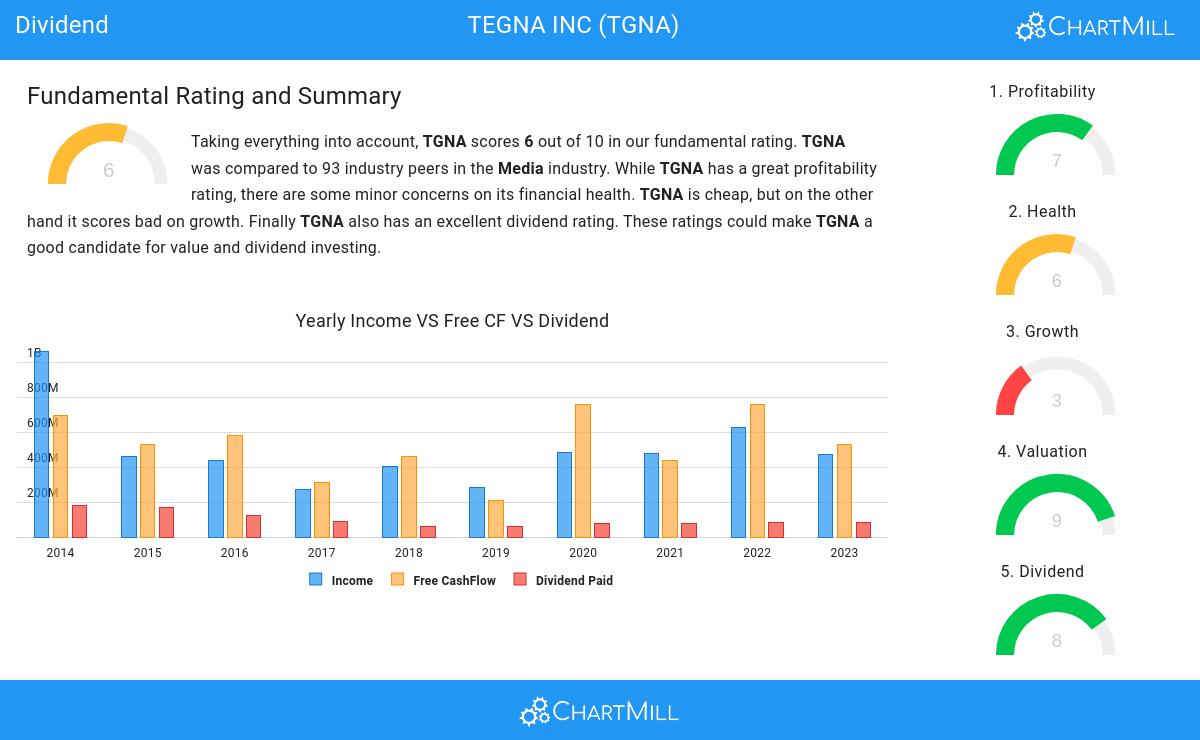
To gauge a stock's dividend quality, ChartMill utilizes a Dividend Rating ranging from 0 to 10. This comprehensive assessment considers various dividend aspects, including yield, history, growth, and sustainability. NYSE:TGNA has achieved a 8 out of 10:
- Compared to an average industry Dividend Yield of 4.37, TGNA pays a better dividend. On top of this TGNA pays more dividend than 85.87% of the companies listed in the same industry.
- Compared to an average S&P500 Dividend Yield of 2.26, TGNA pays a better dividend.
- The dividend of TGNA is nicely growing with an annual growth rate of 8.19%!
- TGNA has paid a dividend for at least 10 years, which is a reliable track record.
- As TGNA did not decrease their dividend in the past 5 years, we can say the dividend looks stable.
- 18.99% of the earnings are spent on dividend by TGNA. This is a low number and sustainable payout ratio.
- The dividend of TGNA is growing, but earnings are growing more, so the dividend growth is sustainable.
Looking at the Health
Every stock is evaluated by ChartMill, receiving a Health Rating on a scale of 0 to 10. This assessment considers different health aspects, including liquidity and solvency, both in absolute terms and relative to industry peers. NYSE:TGNA has achieved a 6 out of 10:
- The Altman-Z score of TGNA (2.74) is better than 81.52% of its industry peers.
- TGNA has a better Debt to FCF ratio (7.84) than 61.96% of its industry peers.
- TGNA has a Current Ratio of 2.58. This indicates that TGNA is financially healthy and has no problem in meeting its short term obligations.
- With an excellent Current ratio value of 2.58, TGNA belongs to the best of the industry, outperforming 81.52% of the companies in the same industry.
- TGNA has a Quick Ratio of 2.58. This indicates that TGNA is financially healthy and has no problem in meeting its short term obligations.
- The Quick ratio of TGNA (2.58) is better than 82.61% of its industry peers.
Profitability Analysis for NYSE:TGNA
ChartMill utilizes a Profitability Rating to assess stocks, scoring them on a scale of 0 to 10. This rating takes into account a variety of profitability ratios and margins, both in absolute terms and in comparison to industry peers. NYSE:TGNA has earned a 7 out of 10:
- TGNA's Return On Assets of 6.24% is amongst the best of the industry. TGNA outperforms 86.96% of its industry peers.
- TGNA's Return On Equity of 15.78% is amongst the best of the industry. TGNA outperforms 86.96% of its industry peers.
- TGNA has a better Return On Invested Capital (6.50%) than 73.91% of its industry peers.
- The Average Return On Invested Capital over the past 3 years for TGNA is above the industry average of 7.05%.
- TGNA has a better Profit Margin (15.44%) than 92.39% of its industry peers.
- TGNA has a Operating Margin of 19.60%. This is amongst the best in the industry. TGNA outperforms 93.48% of its industry peers.
Our Best Dividend screener lists more Best Dividend stocks and is updated daily.
Our latest full fundamental report of TGNA contains the most current fundamental analsysis.
Keep in mind
This is not investing advice! The article highlights some of the observations at the time of writing, but you should always make your own analysis and invest based on your own insights.
