The question on everyone's mind: Will TRUIST FINANCIAL CORP breakout?
By Mill Chart
Last update: Feb 20, 2025
Our stock screener has detected a potential breakout setup on TRUIST FINANCIAL CORP (NYSE:TFC). This breakout pattern is observed when a stock consolidates following a strong upward movement. It's important to note that this pattern is based on technical analysis, and the actual breakout outcome is uncertain. However, it might be worth keeping an eye on NYSE:TFC.
Analyzing the Technical Aspects
ChartMill assigns a proprietary Technical Rating to each stock. The score is computed daily by evaluating various technical indicators and properties. The score ranges from 0 to 10.
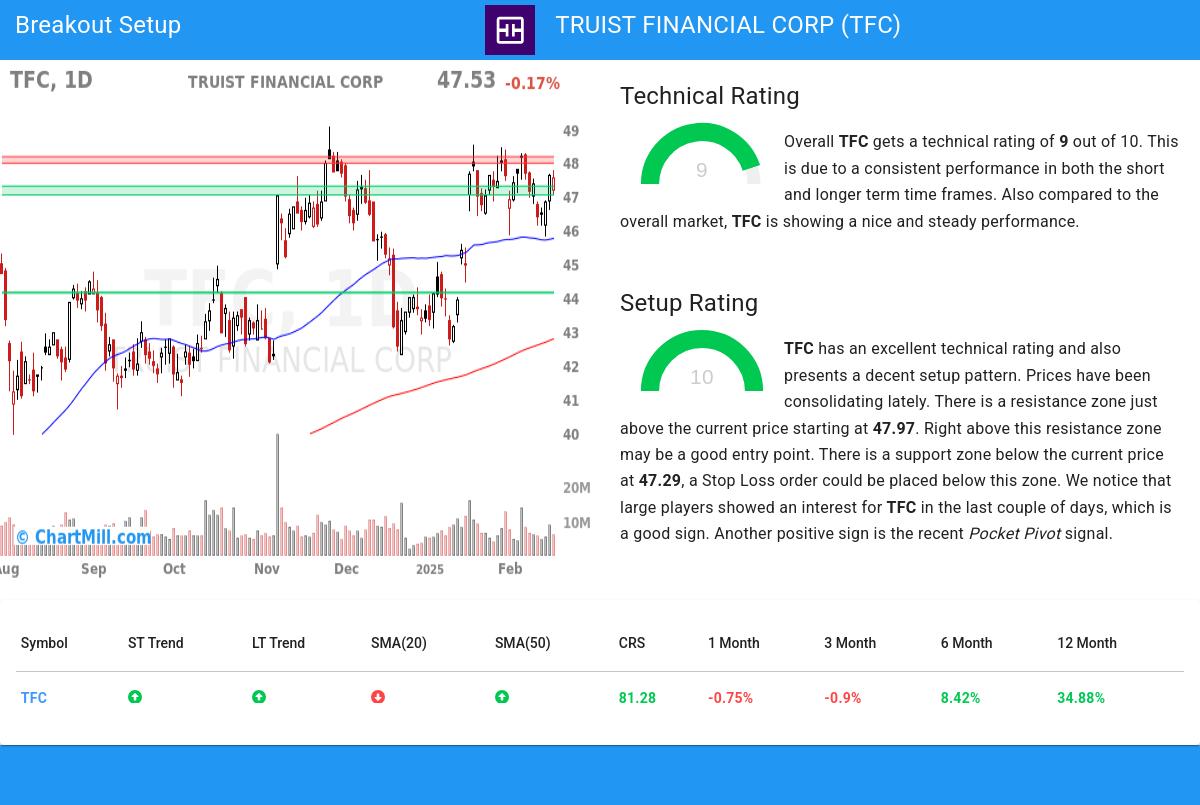
We assign a technical rating of 9 out of 10 to TFC. Both in the recent history as in the last year, TFC has proven to be a steady performer, scoring decent points in every aspect analyzed.
- Both the short term and long term trends are positive. This is a very positive sign.
- Looking at the yearly performance, TFC did better than 81% of all other stocks. On top of that, TFC also shows a nice and consistent pattern of rising prices.
- TFC is currently trading in the upper part of its 52 week range. The S&P500 Index however is currently trading near a new high, so TFC is lagging the market slightly.
- TFC is currently showing a bull flag pattern! A bull flag pattern occurs when prices pull back slightly after a strong rise up. This may be a nice opportunity for an entry.
- TFC is part of the Banks industry. There are 404 other stocks in this industry, TFC did better than 69% of them.
- In the last month TFC has a been trading in a tight range between 45.78 and 48.45.
Our latest full technical report of TFC contains the most current technical analsysis.
How do we evaluate the setup for NYSE:TFC?
Besides the Technical Rating, ChartMill assigns a Setup Rating to every stock to determine the degree of consolidation. This rating, ranging from 0 to 10, is updated daily and evaluates various short-term technical indicators. NYSE:TFC currently holds a 10 as its setup rating, suggesting a particular level of consolidation in the stock.
Besides having an excellent technical rating, TFC also presents a decent setup pattern. Prices have been consolidating lately. There is a resistance zone just above the current price starting at 47.97. Right above this resistance zone may be a good entry point. There is a support zone below the current price at 47.29, a Stop Loss order could be placed below this zone. We notice that large players showed an interest for TFC in the last couple of days, which is a good sign. Very recently a Pocket Pivot signal was observed. This is another positive sign.
Trading breakout setups.
One way to play this would be to wait for the actual breakout to happen and buy when the stock breaks out above the current consolidation zone. A possible place for a stop loss would be below this zone.
Important Note: The content of this article is not intended as trading advice. It is essential to perform your own analysis and exercise caution when making trading decisions. The article presents technical observations generated by automated analysis but does not guarantee any trading outcomes. Always trade responsibly and make independent judgments.
More breakout setups can be found in our Breakout screener.
Disclaimer
This article should in no way be interpreted as advice. The article is based on the observed metrics at the time of writing, but you should always make your own analysis and trade or invest at your own responsibility.
47.53
-0.08 (-0.17%)
Find more stocks in the Stock Screener
TFC Latest News and Analysis
 3 hours ago - ChartmillThe question on everyone's mind: Will TRUIST FINANCIAL CORP breakout?
TRUIST FINANCIAL CORP (NYSE:TFC) Reveals Intriguing Technical Aspects. Indications Suggest NYSE:TFC Could Be on the Verge of a Breakout. Here's What You Need to Know.
