Why TE CONNECTIVITY PLC (NYSE:TEL) provides a good dividend, while having solid fundamentals.
By Mill Chart
Last update: Apr 28, 2025
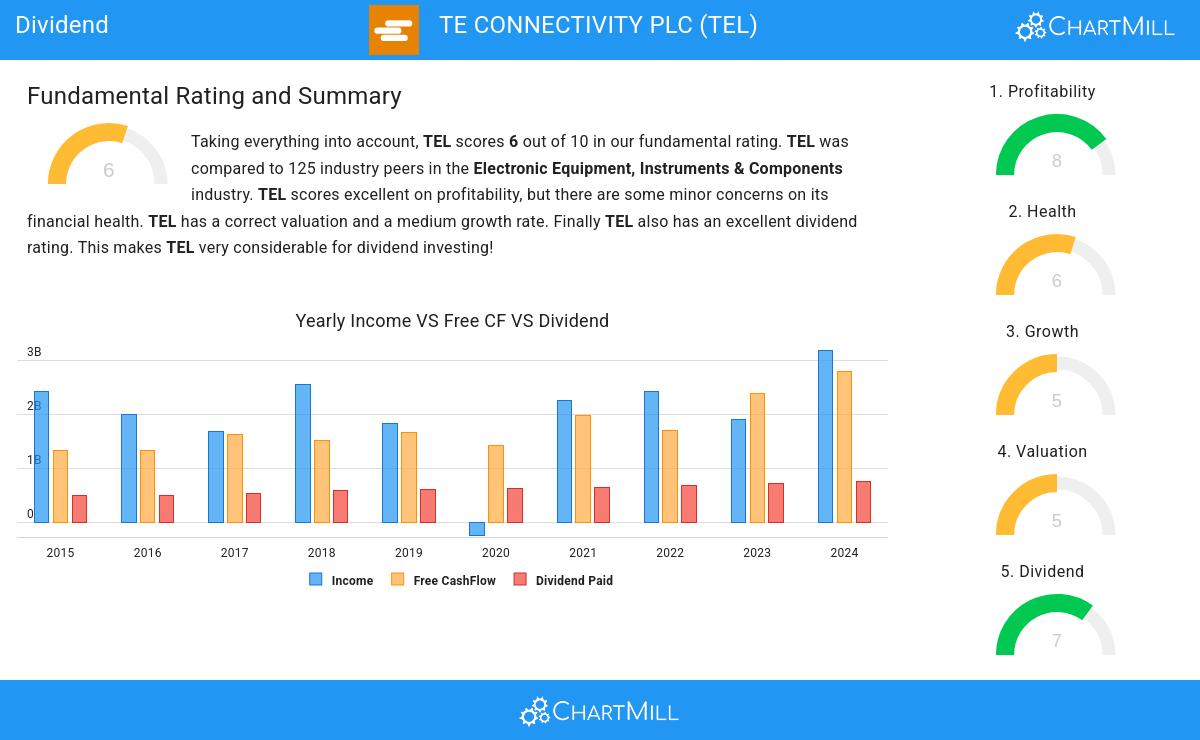
Unearth the potential of TE CONNECTIVITY PLC (NYSE:TEL) as a dividend stock recommended by our stock screening tool. TEL maintains a robust financial footing and delivers a sustainable dividend. We'll delve into the details below.
Dividend Examination for TEL
ChartMill assigns a proprietary Dividend Rating to each stock. The score is computed by evaluating various valuation aspects, like the yield, the history, the dividend growth and sustainability. TEL was assigned a score of 7 for dividend:
- Compared to an average industry Dividend Yield of 2.26, TEL pays a better dividend. On top of this TEL pays more dividend than 92.00% of the companies listed in the same industry.
- On average, the dividend of TEL grows each year by 6.79%, which is quite nice.
- TEL has paid a dividend for at least 10 years, which is a reliable track record.
- TEL has not decreased its dividend for at least 10 years, so it has a reliable track record of non decreasing dividend.
Health Insights: TEL
To gauge a stock's financial health, ChartMill utilizes a Health Rating on a scale of 0 to 10. This comprehensive evaluation encompasses liquidity and solvency, both in absolute terms and in comparison to industry peers. TEL has earned a 6 out of 10:
- An Altman-Z score of 4.25 indicates that TEL is not in any danger for bankruptcy at the moment.
- With a decent Altman-Z score value of 4.25, TEL is doing good in the industry, outperforming 74.40% of the companies in the same industry.
- TEL has a debt to FCF ratio of 2.02. This is a good value and a sign of high solvency as TEL would need 2.02 years to pay back of all of its debts.
- Looking at the Debt to FCF ratio, with a value of 2.02, TEL is in the better half of the industry, outperforming 76.00% of the companies in the same industry.
- A Debt/Equity ratio of 0.27 indicates that TEL is not too dependend on debt financing.
Understanding TEL's Profitability
ChartMill employs its own Profitability Rating system for stock evaluation. This score, ranging from 0 to 10, is derived from an analysis of diverse profitability metrics and margins. In the case of TEL, the assigned 8 is noteworthy for profitability:
- The Return On Assets of TEL (5.88%) is better than 77.60% of its industry peers.
- With an excellent Return On Equity value of 11.50%, TEL belongs to the best of the industry, outperforming 81.60% of the companies in the same industry.
- The Return On Invested Capital of TEL (14.59%) is better than 91.20% of its industry peers.
- Measured over the past 3 years, the Average Return On Invested Capital for TEL is above the industry average of 9.29%.
- The last Return On Invested Capital (14.59%) for TEL is above the 3 year average (14.05%), which is a sign of increasing profitability.
- With an excellent Profit Margin value of 8.67%, TEL belongs to the best of the industry, outperforming 80.80% of the companies in the same industry.
- In the last couple of years the Profit Margin of TEL has grown nicely.
- Looking at the Operating Margin, with a value of 19.14%, TEL belongs to the top of the industry, outperforming 96.80% of the companies in the same industry.
- In the last couple of years the Operating Margin of TEL has grown nicely.
Our Best Dividend screener lists more Best Dividend stocks and is updated daily.
Our latest full fundamental report of TEL contains the most current fundamental analsysis.
Keep in mind
Important Note: The content of this article is not intended as trading advice. It is essential to perform your own analysis and exercise caution when making trading decisions. The article presents observations created by automated analysis but does not guarantee any trading or investment outcomes. Always trade responsibly and make independent judgments.
144.37
+0.85 (+0.59%)
Find more stocks in the Stock Screener
TEL Latest News and Analysis
 2 minutes ago - ChartmillWhy TE CONNECTIVITY PLC (NYSE:TEL) provides a good dividend, while having solid fundamentals.
Why TE CONNECTIVITY PLC (NYSE:TEL) qualifies as a good dividend investing stock.
