
TIDEWATER INC (NYSE:TDW) is not too expensive for the growth it is showing.
By Mill Chart
Last update: Mar 7, 2025
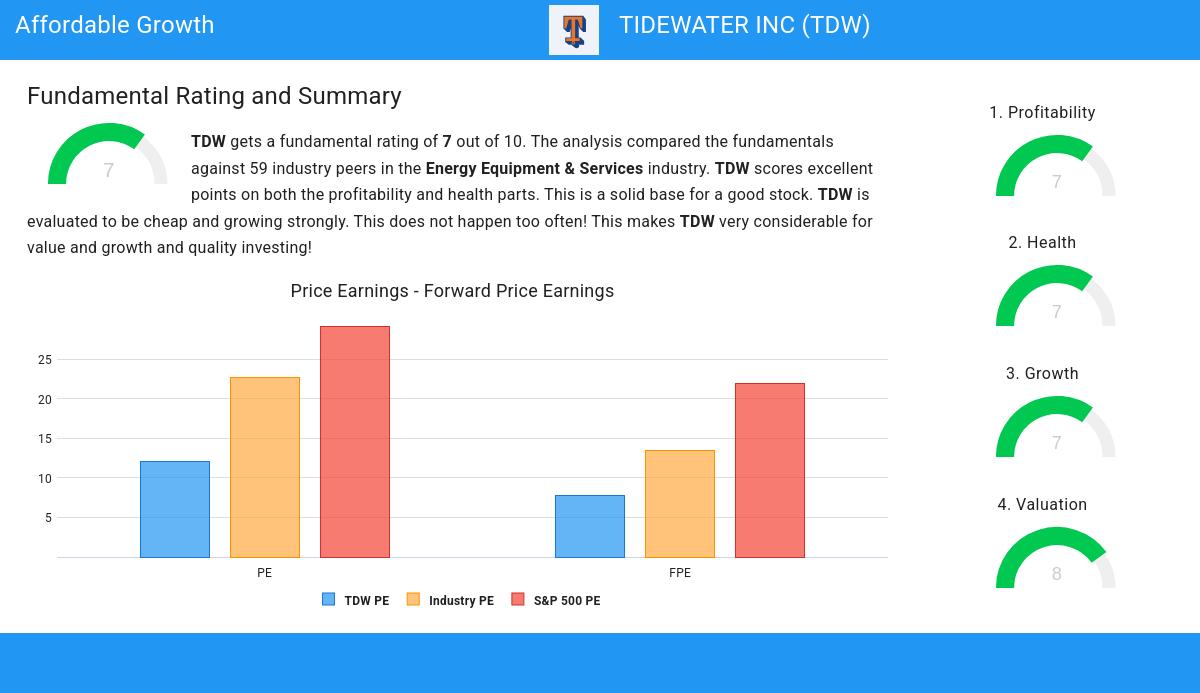
TIDEWATER INC (NYSE:TDW) was identified as an affordable growth stock by our stock screener. NYSE:TDW is showing great growth, but also scores well on profitability, solvency and liquidity. At the same time it seems to be priced reasonably. We'll explore this a bit deeper below.
Evaluating Growth: NYSE:TDW
ChartMill assigns a Growth Rating to every stock. This score ranges from 0 to 10 and evaluates the different growth aspects like EPS and Revenue, both in the past as in the future. NYSE:TDW scores a 7 out of 10:
- TDW shows a strong growth in Earnings Per Share. In the last year, the EPS has been growing by 83.78%, which is quite impressive.
- Looking at the last year, TDW shows a very strong growth in Revenue. The Revenue has grown by 33.25%.
- The Revenue has been growing by 22.57% on average over the past years. This is a very strong growth!
- TDW is expected to show a strong growth in Earnings Per Share. In the coming years, the EPS will grow by 64.45% yearly.
- Based on estimates for the next years, TDW will show a quite strong growth in Revenue. The Revenue will grow by 9.11% on average per year.
Deciphering NYSE:TDW's Valuation Rating
ChartMill assigns a Valuation Rating to each stock, ranging from 0 to 10. This rating is calculated by analyzing different valuation elements, such as price to earnings and free cash flow, both in absolute terms and relative to the market and industry. In the case of NYSE:TDW, the assigned 8 reflects its valuation:
- Based on the Price/Earnings ratio, TDW is valued a bit cheaper than 71.19% of the companies in the same industry.
- When comparing the Price/Earnings ratio of TDW to the average of the S&P500 Index (29.16), we can say TDW is valued rather cheaply.
- Based on the Price/Forward Earnings ratio of 7.83, the valuation of TDW can be described as very cheap.
- Based on the Price/Forward Earnings ratio, TDW is valued cheaper than 93.22% of the companies in the same industry.
- TDW's Price/Forward Earnings ratio indicates a rather cheap valuation when compared to the S&P500 average which is at 21.95.
- Based on the Price/Free Cash Flow ratio, TDW is valued a bit cheaper than 77.97% of the companies in the same industry.
- TDW's low PEG Ratio(NY), which compensates the Price/Earnings for growth, indicates a rather cheap valuation of the company.
- The decent profitability rating of TDW may justify a higher PE ratio.
- A more expensive valuation may be justified as TDW's earnings are expected to grow with 64.45% in the coming years.
Health Assessment of NYSE:TDW
ChartMill assigns a proprietary Health Rating to each stock. The score is computed by evaluating various liquidity and solvency ratios and ranges from 0 to 10. NYSE:TDW was assigned a score of 7 for health:
- With a decent Altman-Z score value of 2.30, TDW is doing good in the industry, outperforming 72.88% of the companies in the same industry.
- The Debt to FCF ratio of TDW is 2.59, which is a good value as it means it would take TDW, 2.59 years of fcf income to pay off all of its debts.
- Looking at the Debt to FCF ratio, with a value of 2.59, TDW is in the better half of the industry, outperforming 66.10% of the companies in the same industry.
- A Current Ratio of 2.11 indicates that TDW has no problem at all paying its short term obligations.
- With a decent Current ratio value of 2.11, TDW is doing good in the industry, outperforming 61.02% of the companies in the same industry.
- A Quick Ratio of 2.00 indicates that TDW has no problem at all paying its short term obligations.
- Looking at the Quick ratio, with a value of 2.00, TDW is in the better half of the industry, outperforming 74.58% of the companies in the same industry.
Evaluating Profitability: NYSE:TDW
ChartMill's Profitability Rating offers a unique perspective on stock analysis, providing scores from 0 to 10. These ratings consider a wide range of profitability metrics and margins, both in comparison to industry peers and on their own merits. For NYSE:TDW, the assigned 7 is a significant indicator of profitability:
- TDW has a Return On Assets of 8.71%. This is in the better half of the industry: TDW outperforms 76.27% of its industry peers.
- With a decent Return On Equity value of 16.22%, TDW is doing good in the industry, outperforming 74.58% of the companies in the same industry.
- Looking at the Return On Invested Capital, with a value of 12.46%, TDW belongs to the top of the industry, outperforming 88.14% of the companies in the same industry.
- The 3 year average ROIC (7.28%) for TDW is below the current ROIC(12.46%), indicating increased profibility in the last year.
- TDW has a better Profit Margin (13.42%) than 81.36% of its industry peers.
- TDW has a better Operating Margin (21.96%) than 86.44% of its industry peers.
- Looking at the Gross Margin, with a value of 48.24%, TDW belongs to the top of the industry, outperforming 89.83% of the companies in the same industry.
- In the last couple of years the Gross Margin of TDW has grown nicely.
More Affordable Growth stocks can be found in our Affordable Growth screener.
Our latest full fundamental report of TDW contains the most current fundamental analsysis.
Keep in mind
This article should in no way be interpreted as advice. The article is based on the observed metrics at the time of writing, but you should always make your own analysis and trade or invest at your own responsibility.
NYSE:TDW (4/29/2025, 3:50:07 PM)
37.53
+0.95 (+2.6%)
Find more stocks in the Stock Screener
