
Our stock screening tool has pinpointed TRIP.COM GROUP LTD-ADR (NASDAQ:TCOM) as a growth stock that isn't overvalued. NASDAQ:TCOM is excelling in various growth indicators while maintaining a solid financial footing. Furthermore, it remains attractively priced. Let's delve into the specifics below.
What does the Growth looks like for NASDAQ:TCOM
To evaluate a stock's growth potential, ChartMill utilizes a Growth Rating on a scale of 0 to 10. This comprehensive assessment considers various growth aspects, including historical and estimated EPS and revenue growth. NASDAQ:TCOM has achieved a 7 out of 10:
- TCOM shows a strong growth in Earnings Per Share. In the last year, the EPS has been growing by 121.01%, which is quite impressive.
- Measured over the past years, TCOM shows a quite strong growth in Earnings Per Share. The EPS has been growing by 15.24% on average per year.
- Looking at the last year, TCOM shows a very strong growth in Revenue. The Revenue has grown by 122.12%.
- TCOM is expected to show quite a strong growth in Earnings Per Share. In the coming years, the EPS will grow by 16.32% yearly.
- The Revenue is expected to grow by 12.87% on average over the next years. This is quite good.
- When comparing the Revenue growth rate of the last years to the growth rate of the upcoming years, we see that the growth is accelerating.
Evaluating Valuation: NASDAQ:TCOM
An integral part of ChartMill's stock analysis is the Valuation Rating, which spans from 0 to 10. This rating evaluates diverse valuation factors, including price to earnings and cash flows, while considering the stock's profitability and growth. NASDAQ:TCOM has received a 6 out of 10:
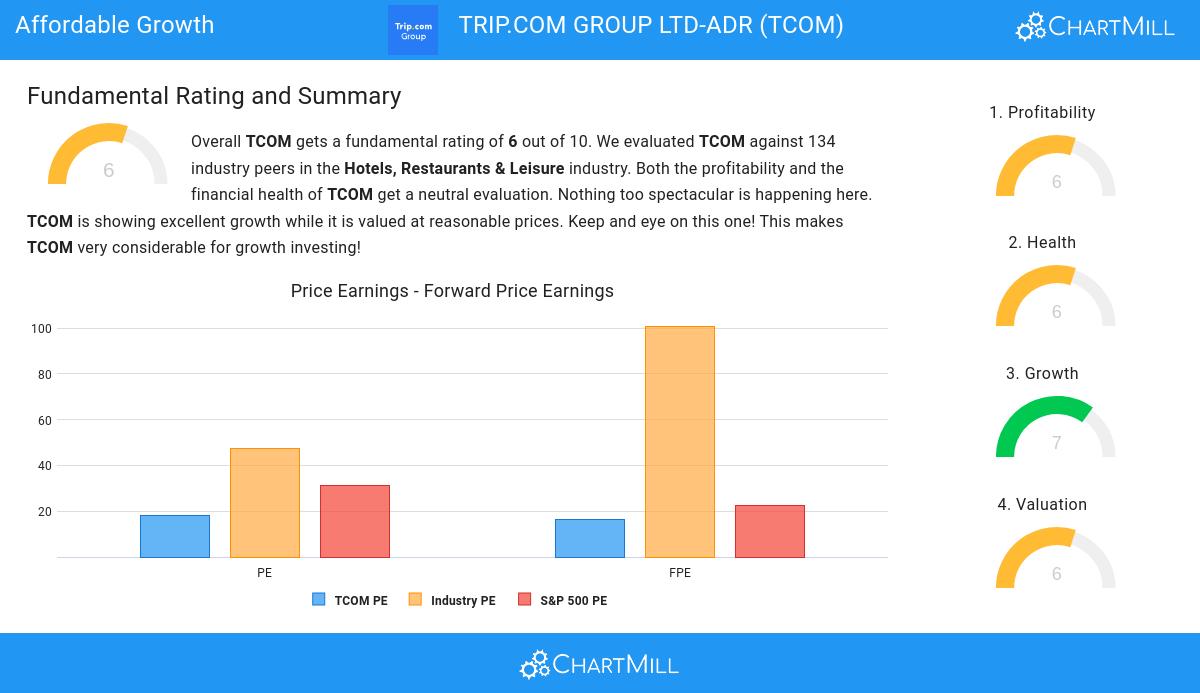
- 79.10% of the companies in the same industry are more expensive than TCOM, based on the Price/Earnings ratio.
- Compared to an average S&P500 Price/Earnings ratio of 31.19, TCOM is valued a bit cheaper.
- 69.40% of the companies in the same industry are more expensive than TCOM, based on the Price/Forward Earnings ratio.
- When comparing the Price/Forward Earnings ratio of TCOM to the average of the S&P500 Index (22.50), we can say TCOM is valued slightly cheaper.
- TCOM's Price/Free Cash Flow ratio is rather cheap when compared to the industry. TCOM is cheaper than 84.33% of the companies in the same industry.
- TCOM's low PEG Ratio(NY), which compensates the Price/Earnings for growth, indicates a rather cheap valuation of the company.
- The decent profitability rating of TCOM may justify a higher PE ratio.
- A more expensive valuation may be justified as TCOM's earnings are expected to grow with 16.53% in the coming years.
Health Analysis for NASDAQ:TCOM
To gauge a stock's financial health, ChartMill utilizes a Health Rating on a scale of 0 to 10. This comprehensive evaluation encompasses liquidity and solvency, both in absolute terms and in comparison to industry peers. NASDAQ:TCOM has earned a 6 out of 10:
- With a decent Altman-Z score value of 2.39, TCOM is doing good in the industry, outperforming 68.66% of the companies in the same industry.
- TCOM has a debt to FCF ratio of 2.10. This is a good value and a sign of high solvency as TCOM would need 2.10 years to pay back of all of its debts.
- Looking at the Debt to FCF ratio, with a value of 2.10, TCOM belongs to the top of the industry, outperforming 84.33% of the companies in the same industry.
- A Debt/Equity ratio of 0.33 indicates that TCOM is not too dependend on debt financing.
- TCOM has a better Debt to Equity ratio (0.33) than 73.13% of its industry peers.
- The Current ratio of TCOM (1.23) is better than 62.69% of its industry peers.
- Looking at the Quick ratio, with a value of 1.23, TCOM is in the better half of the industry, outperforming 65.67% of the companies in the same industry.
Looking at the Profitability
ChartMill's Profitability Rating offers a unique perspective on stock analysis, providing scores from 0 to 10. These ratings consider a wide range of profitability metrics and margins, both in comparison to industry peers and on their own merits. For NASDAQ:TCOM, the assigned 6 is a significant indicator of profitability:
- Looking at the Return On Assets, with a value of 4.53%, TCOM is in the better half of the industry, outperforming 65.67% of the companies in the same industry.
- The Return On Equity of TCOM (8.12%) is better than 64.93% of its industry peers.
- Looking at the Profit Margin, with a value of 22.28%, TCOM belongs to the top of the industry, outperforming 94.78% of the companies in the same industry.
- TCOM's Profit Margin has improved in the last couple of years.
- TCOM has a better Operating Margin (25.44%) than 90.30% of its industry peers.
- TCOM's Operating Margin has improved in the last couple of years.
- The Gross Margin of TCOM (81.75%) is better than 94.03% of its industry peers.
More Affordable Growth stocks can be found in our Affordable Growth screener.
Our latest full fundamental report of TCOM contains the most current fundamental analsysis.
Keep in mind
This article should in no way be interpreted as advice. The article is based on the observed metrics at the time of writing, but you should always make your own analysis and trade or invest at your own responsibility.