
Our stock screener has spotted TRIP.COM GROUP LTD-ADR (NASDAQ:TCOM) as an undervalued stock with solid fundamentals. NASDAQ:TCOM shows decent health and profitability. At the same time it remains remains attractively priced. We'll dive into each aspect below.
Valuation Analysis for NASDAQ:TCOM
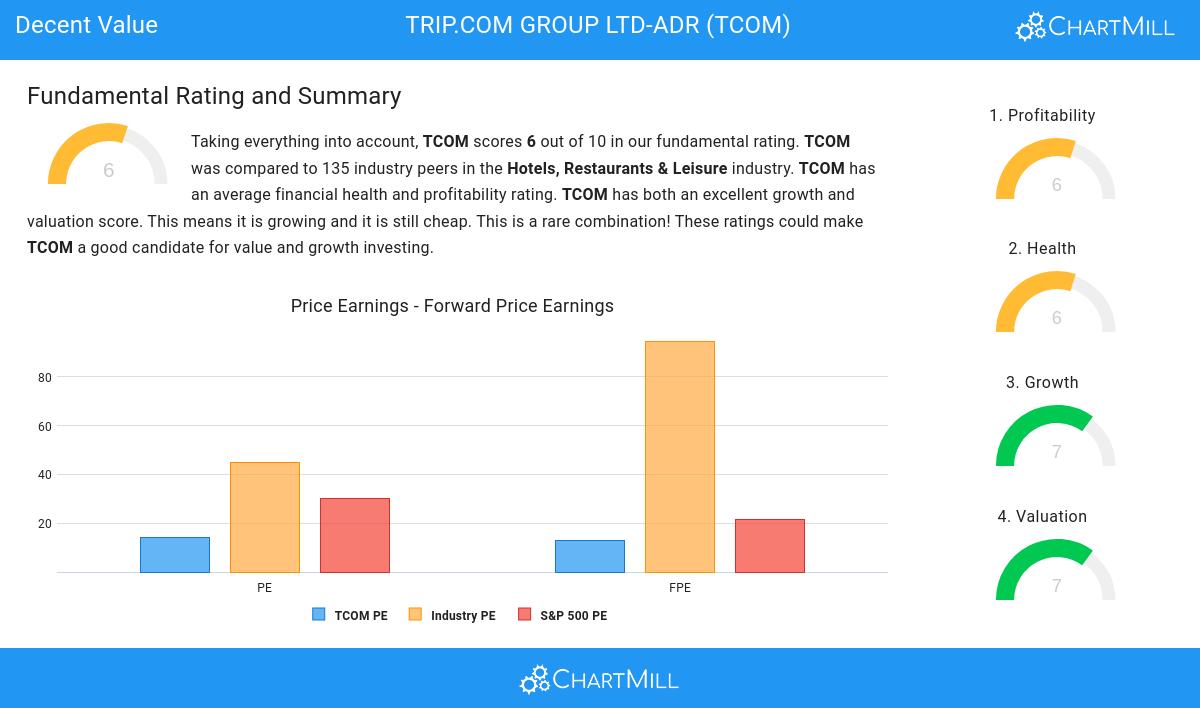
ChartMill assigns a Valuation Rating to each stock, ranging from 0 to 10. This rating is calculated by analyzing different valuation elements, such as price to earnings and free cash flow, both in absolute terms and relative to the market and industry. In the case of NASDAQ:TCOM, the assigned 7 reflects its valuation:
- Based on the Price/Earnings ratio, TCOM is valued cheaply inside the industry as 83.70% of the companies are valued more expensively.
- When comparing the Price/Earnings ratio of TCOM to the average of the S&P500 Index (29.93), we can say TCOM is valued rather cheaply.
- Compared to the rest of the industry, the Price/Forward Earnings ratio of TCOM indicates a somewhat cheap valuation: TCOM is cheaper than 77.78% of the companies listed in the same industry.
- When comparing the Price/Forward Earnings ratio of TCOM to the average of the S&P500 Index (21.62), we can say TCOM is valued slightly cheaper.
- Compared to the rest of the industry, the Price/Free Cash Flow ratio of TCOM indicates a rather cheap valuation: TCOM is cheaper than 88.15% of the companies listed in the same industry.
- TCOM's low PEG Ratio(NY), which compensates the Price/Earnings for growth, indicates a rather cheap valuation of the company.
- TCOM has a very decent profitability rating, which may justify a higher PE ratio.
- A more expensive valuation may be justified as TCOM's earnings are expected to grow with 16.53% in the coming years.
Profitability Analysis for NASDAQ:TCOM
ChartMill assigns a proprietary Profitability Rating to each stock. The score is computed by evaluating various profitability ratios and margins and ranges from 0 to 10. NASDAQ:TCOM was assigned a score of 6 for profitability:
- The Return On Assets of TCOM (4.53%) is better than 65.19% of its industry peers.
- Looking at the Return On Equity, with a value of 8.12%, TCOM is in the better half of the industry, outperforming 65.19% of the companies in the same industry.
- Looking at the Profit Margin, with a value of 22.28%, TCOM belongs to the top of the industry, outperforming 94.81% of the companies in the same industry.
- TCOM's Profit Margin has improved in the last couple of years.
- Looking at the Operating Margin, with a value of 25.44%, TCOM belongs to the top of the industry, outperforming 90.37% of the companies in the same industry.
- In the last couple of years the Operating Margin of TCOM has grown nicely.
- With an excellent Gross Margin value of 81.75%, TCOM belongs to the best of the industry, outperforming 94.07% of the companies in the same industry.
Health Analysis for NASDAQ:TCOM
A critical element of ChartMill's stock evaluation is the Health Rating, which spans from 0 to 10. This rating considers multiple health factors, including liquidity and solvency, both in absolute terms and relative to industry peers. NASDAQ:TCOM has received a 6 out of 10:
- TCOM has a Altman-Z score of 2.02. This is in the better half of the industry: TCOM outperforms 60.74% of its industry peers.
- TCOM has a debt to FCF ratio of 2.10. This is a good value and a sign of high solvency as TCOM would need 2.10 years to pay back of all of its debts.
- TCOM has a Debt to FCF ratio of 2.10. This is amongst the best in the industry. TCOM outperforms 85.19% of its industry peers.
- A Debt/Equity ratio of 0.33 indicates that TCOM is not too dependend on debt financing.
- Looking at the Debt to Equity ratio, with a value of 0.33, TCOM is in the better half of the industry, outperforming 72.59% of the companies in the same industry.
- TCOM has a Current ratio of 1.23. This is in the better half of the industry: TCOM outperforms 62.96% of its industry peers.
- With a decent Quick ratio value of 1.23, TCOM is doing good in the industry, outperforming 65.93% of the companies in the same industry.
Analyzing Growth Metrics
ChartMill assigns a Growth Rating to each stock, ranging from 0 to 10. This rating is determined by analyzing different growth elements, including EPS and revenue growth, spanning both historical and future figures. In the case of NASDAQ:TCOM, the assigned 7 reflects its growth potential:
- TCOM shows a strong growth in Earnings Per Share. In the last year, the EPS has been growing by 121.01%, which is quite impressive.
- The Earnings Per Share has been growing by 15.24% on average over the past years. This is quite good.
- Looking at the last year, TCOM shows a very strong growth in Revenue. The Revenue has grown by 122.12%.
- Based on estimates for the next years, TCOM will show a quite strong growth in Earnings Per Share. The EPS will grow by 16.32% on average per year.
- TCOM is expected to show quite a strong growth in Revenue. In the coming years, the Revenue will grow by 12.87% yearly.
- The Revenue growth rate is accelerating: in the next years the growth will be better than in the last years.
More Decent Value stocks can be found in our Decent Value screener.
Our latest full fundamental report of TCOM contains the most current fundamental analsysis.
Disclaimer
This is not investing advice! The article highlights some of the observations at the time of writing, but you should always make your own analysis and invest based on your own insights.