
Here's TRIP.COM GROUP LTD-ADR (NASDAQ:TCOM) for you, a growth stock our stock screener believes is undervalued. NASDAQ:TCOM is scoring impressively in terms of growth while demonstrating strong financials. On top of that, it remains attractively priced. Let's break it down further.
How We Gauge Growth for NASDAQ:TCOM
ChartMill employs its own Growth Rating system for all stocks. This score, ranging from 0 to 10, is derived by evaluating different growth factors, such as EPS and revenue growth, taking into account both past performance and future projections. NASDAQ:TCOM has earned a 7 for growth:
- TCOM shows a strong growth in Earnings Per Share. In the last year, the EPS has been growing by 121.01%, which is quite impressive.
- TCOM shows quite a strong growth in Earnings Per Share. Measured over the last years, the EPS has been growing by 15.24% yearly.
- Looking at the last year, TCOM shows a very strong growth in Revenue. The Revenue has grown by 122.12%.
- Based on estimates for the next years, TCOM will show a quite strong growth in Earnings Per Share. The EPS will grow by 16.32% on average per year.
- The Revenue is expected to grow by 12.87% on average over the next years. This is quite good.
- When comparing the Revenue growth rate of the last years to the growth rate of the upcoming years, we see that the growth is accelerating.
How do we evaluate the Valuation for NASDAQ:TCOM?
An integral part of ChartMill's stock analysis is the Valuation Rating, which spans from 0 to 10. This rating evaluates diverse valuation factors, including price to earnings and cash flows, while considering the stock's profitability and growth. NASDAQ:TCOM has received a 7 out of 10:
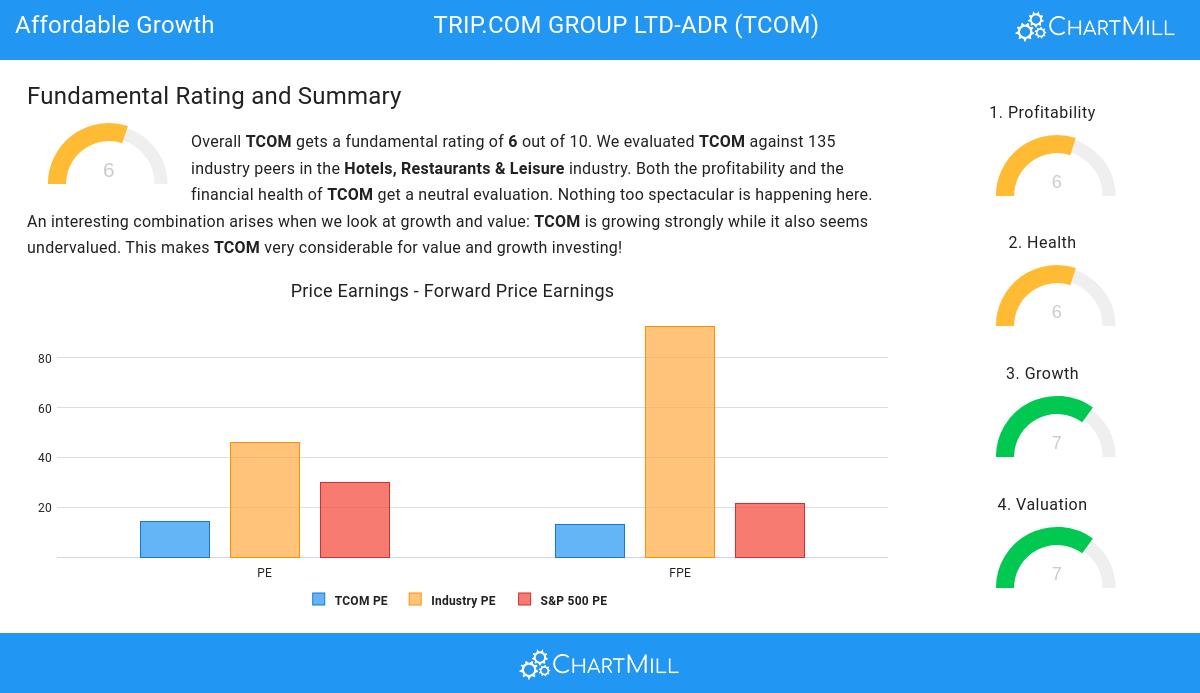
- TCOM's Price/Earnings ratio is rather cheap when compared to the industry. TCOM is cheaper than 82.96% of the companies in the same industry.
- Compared to an average S&P500 Price/Earnings ratio of 29.93, TCOM is valued rather cheaply.
- 77.78% of the companies in the same industry are more expensive than TCOM, based on the Price/Forward Earnings ratio.
- TCOM is valuated rather cheaply when we compare the Price/Forward Earnings ratio to 21.46, which is the current average of the S&P500 Index.
- TCOM's Price/Free Cash Flow ratio is rather cheap when compared to the industry. TCOM is cheaper than 88.89% of the companies in the same industry.
- TCOM's low PEG Ratio(NY), which compensates the Price/Earnings for growth, indicates a rather cheap valuation of the company.
- TCOM has a very decent profitability rating, which may justify a higher PE ratio.
- TCOM's earnings are expected to grow with 16.53% in the coming years. This may justify a more expensive valuation.
Health Analysis for NASDAQ:TCOM
ChartMill utilizes a Health Rating to assess stocks, scoring them on a scale of 0 to 10. This rating takes into account a variety of liquidity and solvency ratios, both in absolute terms and in comparison to industry peers. NASDAQ:TCOM has earned a 6 out of 10:
- TCOM has a debt to FCF ratio of 2.10. This is a good value and a sign of high solvency as TCOM would need 2.10 years to pay back of all of its debts.
- TCOM has a Debt to FCF ratio of 2.10. This is amongst the best in the industry. TCOM outperforms 85.19% of its industry peers.
- A Debt/Equity ratio of 0.33 indicates that TCOM is not too dependend on debt financing.
- The Debt to Equity ratio of TCOM (0.33) is better than 72.59% of its industry peers.
- With a decent Current ratio value of 1.23, TCOM is doing good in the industry, outperforming 62.22% of the companies in the same industry.
- With a decent Quick ratio value of 1.23, TCOM is doing good in the industry, outperforming 65.93% of the companies in the same industry.
Analyzing Profitability Metrics
ChartMill's Profitability Rating offers a unique perspective on stock analysis, providing scores from 0 to 10. These ratings consider a wide range of profitability metrics and margins, both in comparison to industry peers and on their own merits. For NASDAQ:TCOM, the assigned 6 is a significant indicator of profitability:
- The Return On Assets of TCOM (4.53%) is better than 65.19% of its industry peers.
- TCOM has a better Return On Equity (8.12%) than 64.44% of its industry peers.
- Looking at the Profit Margin, with a value of 22.28%, TCOM belongs to the top of the industry, outperforming 94.81% of the companies in the same industry.
- TCOM's Profit Margin has improved in the last couple of years.
- Looking at the Operating Margin, with a value of 25.44%, TCOM belongs to the top of the industry, outperforming 90.37% of the companies in the same industry.
- In the last couple of years the Operating Margin of TCOM has grown nicely.
- With an excellent Gross Margin value of 81.75%, TCOM belongs to the best of the industry, outperforming 94.07% of the companies in the same industry.
Every day, new Affordable Growth stocks can be found on ChartMill in our Affordable Growth screener.
Check the latest full fundamental report of TCOM for a complete fundamental analysis.
Disclaimer
This article should in no way be interpreted as advice. The article is based on the observed metrics at the time of writing, but you should always make your own analysis and trade or invest at your own responsibility.