
There are signs that NYSE:T may be ready to breakout.
By Mill Chart
Last update: Nov 12, 2024
Our stock screener has flagged AT&T INC (NYSE:T) as a potential breakout candidate. This occurs when the stock shows signs of consolidation after a notable upward trend. While we can't predict the actual breakout, it's worth monitoring NYSE:T for potential movement.
Analyzing the Technical Aspects
ChartMill utilizes a proprietary algorithm to assign a Technical Rating to every stock. This rating, ranging from 0 to 10, is computed daily by analyzing a variety of technical indicators and properties.
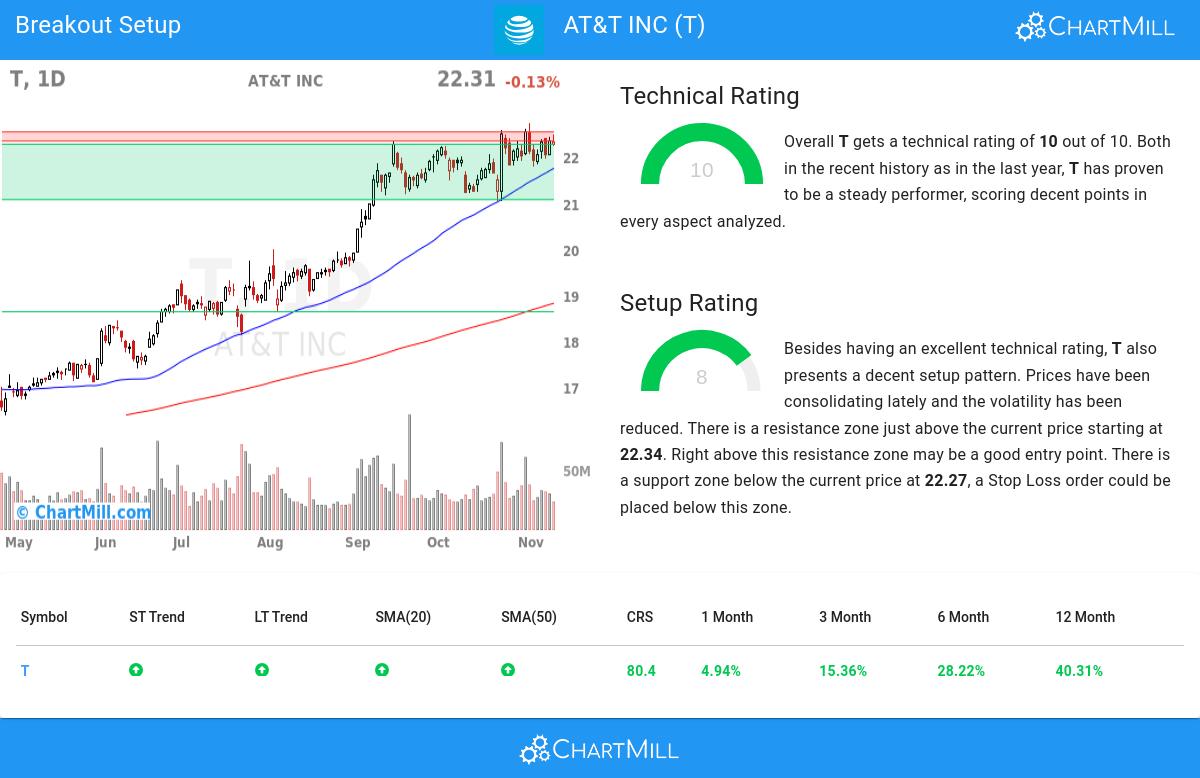
Taking everything into account, T scores 10 out of 10 in our technical rating. Both in the recent history as in the last year, T has proven to be a steady performer, scoring decent points in every aspect analyzed.
- The long and short term trends are both positive. This is looking good!
- Looking at the yearly performance, T did better than 80% of all other stocks. We also observe that the gains produced by T over the past year are nicely spread over this period.
- T is one of the better performing stocks in the Diversified Telecommunication Services industry, it outperforms 75% of 33 stocks in the same industry.
- T is currently trading near its 52 week high, which is a good sign. The S&P500 Index however is also trading near new highs, which makes the performance in line with the market.
- In the last month T has a been trading in the 21.05 - 22.73 range, which is quite wide. It is currently trading near the high of this range.
- Prices have been consolidating recently, this may present a good entry opportunity.
Check the latest full technical report of T for a complete technical analysis.
How do we evaluate the setup for NYSE:T?
Besides the Technical Rating, ChartMill also assign a Setup Rating to every stock. This setup score also ranges from 0 to 10 and determines to which extend the stock is consolidating. This is achieved by evaluating multiple short term technical indicators. NYSE:T currently has a 8 as setup rating:
T has an excellent technical rating and also presents a decent setup pattern. We see reduced volatility while prices have been consolidating in the most recent period. There is a resistance zone just above the current price starting at 22.34. Right above this resistance zone may be a good entry point. There is a support zone below the current price at 22.27, a Stop Loss order could be placed below this zone.
Trading setups like NYSE:T
One way to play this would be to wait for the actual breakout to happen and buy when the stock breaks out above the current consolidation zone. A possible place for a stop loss would be below this zone.
Important Note: The content of this article is not intended as trading advice. It is essential to perform your own analysis and exercise caution when making trading decisions. The article presents technical observations generated by automated analysis but does not guarantee any trading outcomes. Always trade responsibly and make independent judgments.
More breakout setups can be found in our Breakout screener.
Keep in mind
This is not investing advice! The article highlights some of the observations at the time of writing, but you should always make your own analysis and invest based on your own insights.
NYSE:T (2/19/2025, 3:35:08 PM)
26.155
+0.09 (+0.33%)
Find more stocks in the Stock Screener
T Latest News and Analysis
 5 days ago - ChartmillWhich S&P500 stocks are the most active on Friday?
Looking for the most active S&P500 stocks in today's session? Join us as we dive into the US markets on Friday and discover the stocks that are dominating the trading activity and setting the pace for the market.
6 days ago - ChartmillThursday's session: most active stock in the S&P500 indexCurious about the most active S&P500 stocks in today's session? Get insights into the stocks that are leading the way in terms of trading volume and market attention.
7 days ago - ChartmillWhich S&P500 stocks are the most active on Wednesday?Explore the S&P500 index on Wednesday and find out which stocks are the most active in today's session. Stay updated with the stocks that are capturing market interest.
8 days ago - ChartmillTuesday's session: most active stock in the S&P500 indexExplore the S&P500 index on Tuesday and find out which stocks are the most active in today's session. Stay updated with the stocks that are capturing market interest and driving market movements.
 16 days ago - ChartmillExploring the top movers within the S&P500 index during today's session.
Let's delve into the developments on the US markets one hour before the close of the markets on Monday. Below, you'll find the top gainers and losers within the S&P500 index during today's session.
16 days ago - ChartmillWhich S&P500 stocks are the most active on Monday?Curious about the most active S&P500 stocks in today's session? Get insights into the stocks that are leading the way in terms of trading volume and market attention.
16 days ago - ChartmillTop S&P500 movers in Monday's sessionStay informed about the performance of the S&P500 index in the middle of the day on Monday. Uncover the top gainers and losers in today's session for valuable insights.
20 days ago - ChartmillMost active S&P500 stocks in Thursday's sessionCurious about the most active S&P500 stocks in today's session? Join us as we explore the US markets on Thursday and uncover the stocks that are leading the way in terms of trading volume and market attention.
