
NYSE:T may be ready to breakout.
By Mill Chart
Last update: Nov 7, 2024
Our stock screener has flagged AT&T INC (NYSE:T) as a potential breakout candidate. This occurs when the stock shows signs of consolidation after a notable upward trend. While we can't predict the actual breakout, it's worth monitoring NYSE:T for potential movement.
Analyzing the Technical Aspects
Every day ChartMill assigns a Technical Rating to every stock. The score ranges from 0 to 10 and is determined by evaluating multiple technical indicators and properties.
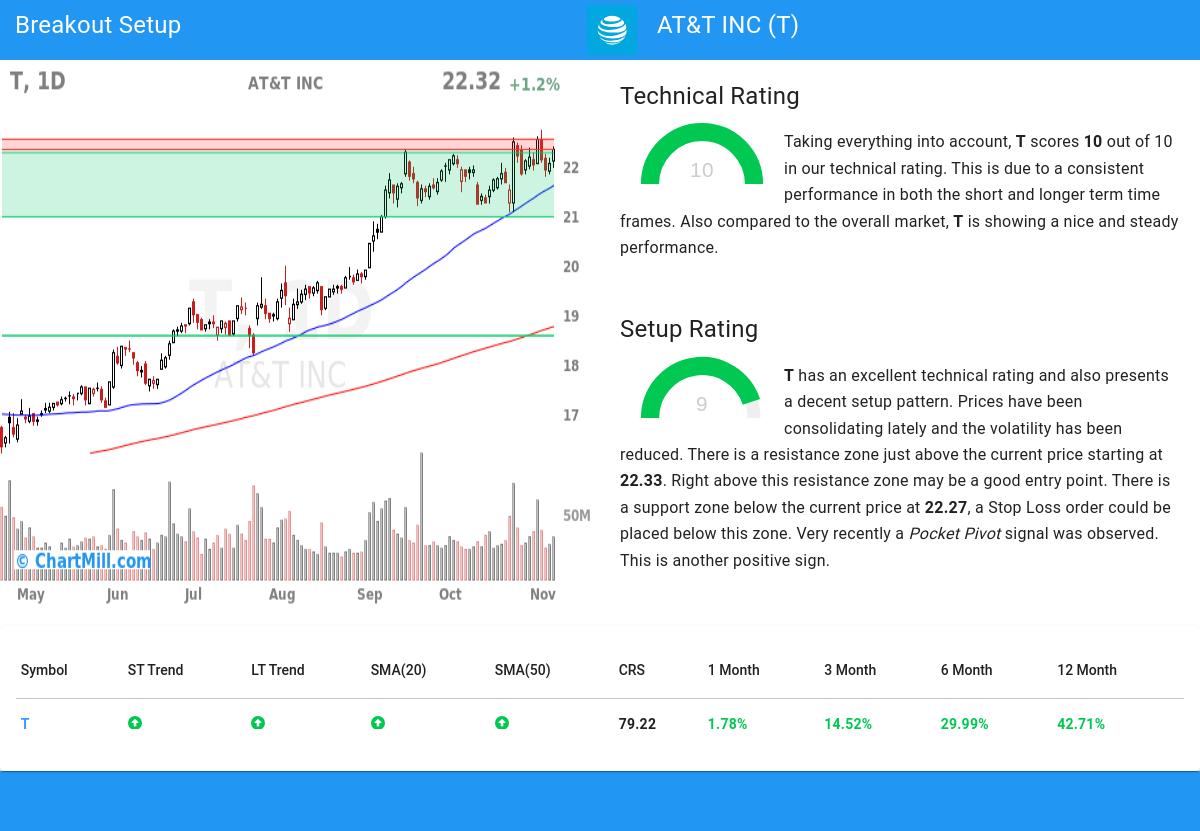
We assign a technical rating of 10 out of 10 to T. This is due to a consistent performance in both the short and longer term time frames. Also compared to the overall market, T is showing a nice and steady performance.
- The long and short term trends are both positive. This is looking good!
- When comparing the yearly performance of all stocks, we notice that T is one of the better performing stocks in the market, outperforming 79% of all stocks. On top of that, T also shows a nice and consistent pattern of rising prices.
- T is part of the Diversified Telecommunication Services industry. There are 33 other stocks in this industry. T outperforms 71% of them.
- T is currently trading near its 52 week high, which is a good sign. The S&P500 Index however is also trading near new highs, which makes the performance in line with the market.
- In the last month T has a been trading in the 21.05 - 22.73 range, which is quite wide. It is currently trading in the middle of this range, so some resistance may be found above.
Our latest full technical report of T contains the most current technical analsysis.
How does the Setup look for NYSE:T
Alongside the Technical Rating, ChartMill assigns a Setup Rating to evaluate the consolidation level of a stock. This rating, ranging from 0 to 10, is updated daily and considers various short-term technical indicators. The current setup rating for NYSE:T is 9:
Besides having an excellent technical rating, T also presents a decent setup pattern. Prices have been consolidating lately and the volatility has been reduced. There is a resistance zone just above the current price starting at 22.33. Right above this resistance zone may be a good entry point. There is a support zone below the current price at 22.27, a Stop Loss order could be placed below this zone. Very recently a Pocket Pivot signal was observed. This is another positive sign.
Trading breakout setups.
To potentially initiate a trade, it is common practice to wait for the stock to break out of the consolidation zone. This breakout signifies a potential upward movement, and traders may enter the stock at that point. Conversely, if the stock falls back below the consolidation zone, it may be sold at a loss.
Disclaimer: This article is not intended to provide trading advice. It is crucial to conduct your own analysis and consider your own observations and trading style when making investment decisions. The article solely presents technical observations and should not be relied upon as a sole basis for trading.
Every day, new breakout setups can be found on ChartMill in our Breakout screener.
Disclaimer
Important Note: The content of this article is not intended as trading advice. It is essential to perform your own analysis and exercise caution when making trading decisions. The article presents observations created by automated analysis but does not guarantee any trading or investment outcomes. Always trade responsibly and make independent judgments.
NYSE:T (2/19/2025, 3:43:08 PM)
26.14
+0.07 (+0.27%)
Find more stocks in the Stock Screener
T Latest News and Analysis
 5 days ago - ChartmillWhich S&P500 stocks are the most active on Friday?
Looking for the most active S&P500 stocks in today's session? Join us as we dive into the US markets on Friday and discover the stocks that are dominating the trading activity and setting the pace for the market.
6 days ago - ChartmillThursday's session: most active stock in the S&P500 indexCurious about the most active S&P500 stocks in today's session? Get insights into the stocks that are leading the way in terms of trading volume and market attention.
7 days ago - ChartmillWhich S&P500 stocks are the most active on Wednesday?Explore the S&P500 index on Wednesday and find out which stocks are the most active in today's session. Stay updated with the stocks that are capturing market interest.
8 days ago - ChartmillTuesday's session: most active stock in the S&P500 indexExplore the S&P500 index on Tuesday and find out which stocks are the most active in today's session. Stay updated with the stocks that are capturing market interest and driving market movements.
 16 days ago - ChartmillExploring the top movers within the S&P500 index during today's session.
Let's delve into the developments on the US markets one hour before the close of the markets on Monday. Below, you'll find the top gainers and losers within the S&P500 index during today's session.
16 days ago - ChartmillWhich S&P500 stocks are the most active on Monday?Curious about the most active S&P500 stocks in today's session? Get insights into the stocks that are leading the way in terms of trading volume and market attention.
16 days ago - ChartmillTop S&P500 movers in Monday's sessionStay informed about the performance of the S&P500 index in the middle of the day on Monday. Uncover the top gainers and losers in today's session for valuable insights.
20 days ago - ChartmillMost active S&P500 stocks in Thursday's sessionCurious about the most active S&P500 stocks in today's session? Join us as we explore the US markets on Thursday and uncover the stocks that are leading the way in terms of trading volume and market attention.
