
AT&T INC (NYSE:T) Reveals Intriguing Technical Aspects. Here's What You Need to Know.
By Mill Chart
Last update: Oct 9, 2024
We've identified AT&T INC (NYSE:T) as a potential breakout candidate based on our stock screener's analysis. This breakout setup pattern suggests that after a strong uptrend, the stock is currently consolidating, potentially signaling a continuation of the trend. Keep an eye on NYSE:T for further developments.
Analyzing the Technical Aspects
Every day ChartMill assigns a Technical Rating to every stock. The score ranges from 0 to 10 and is determined by evaluating multiple technical indicators and properties.
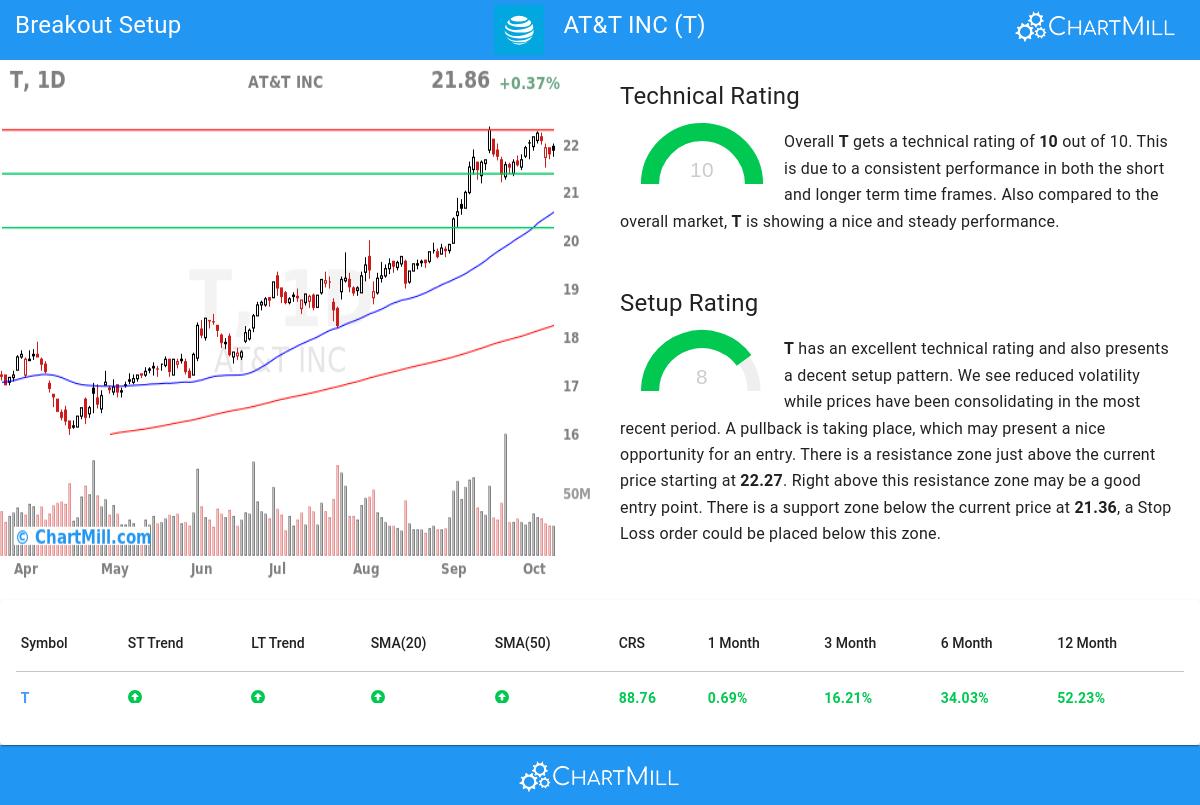
Taking everything into account, T scores 10 out of 10 in our technical rating. Both in the recent history as in the last year, T has proven to be a steady performer, scoring decent points in every aspect analyzed.
- Both the short term and long term trends are positive. This is a very positive sign.
- Looking at the yearly performance, T did better than 88% of all other stocks. On top of that, T also shows a nice and consistent pattern of rising prices.
- T is part of the Diversified Telecommunication Services industry. There are 34 other stocks in this industry. T outperforms 87% of them.
- T is currently trading near its 52 week high, which is a good sign. The S&P500 Index however is also trading near new highs, which makes the performance in line with the market.
- T is currently showing a bull flag pattern! A bull flag pattern occurs when prices pull back slightly after a strong rise up. This may be a nice opportunity for an entry.
- In the last month T has a been trading in a tight range between 21.17 and 22.34.
Our latest full technical report of T contains the most current technical analsysis.
Looking at the Setup
ChartMill incorporates a Setup Rating in its analysis, which measures the extent of consolidation in a stock over recent days and weeks. This rating, ranging from 0 to 10, is updated daily and takes into account multiple short-term technical indicators. The current setup rating for NYSE:T is 8:
Besides having an excellent technical rating, T also presents a decent setup pattern. Prices have been consolidating lately and the volatility has been reduced. A pullback is taking place, which may present a nice opportunity for an entry. There is a resistance zone just above the current price starting at 22.27. Right above this resistance zone may be a good entry point. There is a support zone below the current price at 21.36, a Stop Loss order could be placed below this zone.
How can NYSE:T be traded?
For a potential trade one would typically wait until the stock breaks out of the consolidation zone to enter the stock and it could be sold again for a loss when it would fall back below the zone.
Important Note: The content of this article is not intended as trading advice. It is essential to perform your own analysis and exercise caution when making trading decisions. The article presents technical observations generated by automated analysis but does not guarantee any trading outcomes. Always trade responsibly and make independent judgments.
More breakout setups can be found in our Breakout screener.
Keep in mind
This article should in no way be interpreted as advice. The article is based on the observed metrics at the time of writing, but you should always make your own analysis and trade or invest at your own responsibility.
NYSE:T (2/19/2025, 3:12:07 PM)
26.225
+0.16 (+0.59%)
Find more stocks in the Stock Screener
T Latest News and Analysis
 5 days ago - ChartmillWhich S&P500 stocks are the most active on Friday?
Looking for the most active S&P500 stocks in today's session? Join us as we dive into the US markets on Friday and discover the stocks that are dominating the trading activity and setting the pace for the market.
6 days ago - ChartmillThursday's session: most active stock in the S&P500 indexCurious about the most active S&P500 stocks in today's session? Get insights into the stocks that are leading the way in terms of trading volume and market attention.
7 days ago - ChartmillWhich S&P500 stocks are the most active on Wednesday?Explore the S&P500 index on Wednesday and find out which stocks are the most active in today's session. Stay updated with the stocks that are capturing market interest.
8 days ago - ChartmillTuesday's session: most active stock in the S&P500 indexExplore the S&P500 index on Tuesday and find out which stocks are the most active in today's session. Stay updated with the stocks that are capturing market interest and driving market movements.
 16 days ago - ChartmillExploring the top movers within the S&P500 index during today's session.
Let's delve into the developments on the US markets one hour before the close of the markets on Monday. Below, you'll find the top gainers and losers within the S&P500 index during today's session.
16 days ago - ChartmillWhich S&P500 stocks are the most active on Monday?Curious about the most active S&P500 stocks in today's session? Get insights into the stocks that are leading the way in terms of trading volume and market attention.
16 days ago - ChartmillTop S&P500 movers in Monday's sessionStay informed about the performance of the S&P500 index in the middle of the day on Monday. Uncover the top gainers and losers in today's session for valuable insights.
20 days ago - ChartmillMost active S&P500 stocks in Thursday's sessionCurious about the most active S&P500 stocks in today's session? Join us as we explore the US markets on Thursday and uncover the stocks that are leading the way in terms of trading volume and market attention.
