Why NYSE:SU provides a good dividend, while having solid fundamentals.
By Mill Chart
Last update: Feb 25, 2025
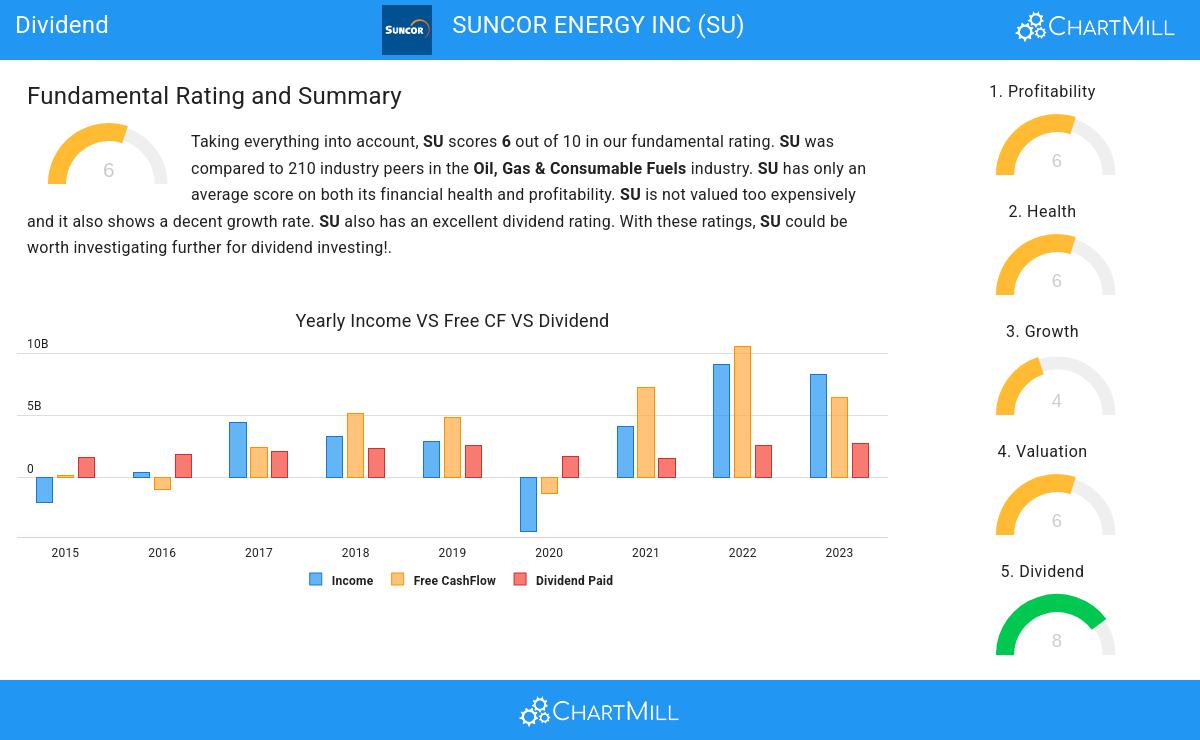
Unearth the potential of SUNCOR ENERGY INC (NYSE:SU) as a dividend stock recommended by our stock screening tool. NYSE:SU maintains a robust financial footing and delivers a sustainable dividend. We'll delve into the details below.
ChartMill's Evaluation of Dividend
ChartMill provides a Dividend Rating for every stock, ranging from 0 to 10. This rating assesses various dividend aspects, including yield, growth, and sustainability. NYSE:SU earns a 8 out of 10:
- SU has a Yearly Dividend Yield of 4.00%, which is a nice return.
- SU's Dividend Yield is rather good when compared to the S&P500 average which is at 2.27.
- On average, the dividend of SU grows each year by 7.66%, which is quite nice.
- SU has been paying a dividend for at least 10 years, so it has a reliable track record.
- 34.85% of the earnings are spent on dividend by SU. This is a low number and sustainable payout ratio.
- The dividend of SU is growing, but earnings are growing more, so the dividend growth is sustainable.
Health Assessment of NYSE:SU
ChartMill assigns a Health Rating to every stock. This score ranges from 0 to 10 and evaluates the different health aspects like liquidity and solvency, both absolutely, but also relative to the industry peers. NYSE:SU scores a 6 out of 10:
- Looking at the Altman-Z score, with a value of 2.23, SU is in the better half of the industry, outperforming 67.00% of the companies in the same industry.
- SU has a debt to FCF ratio of 1.72. This is a very positive value and a sign of high solvency as it would only need 1.72 years to pay back of all of its debts.
- Looking at the Debt to FCF ratio, with a value of 1.72, SU is in the better half of the industry, outperforming 79.31% of the companies in the same industry.
- SU has a Debt/Equity ratio of 0.32. This is a healthy value indicating a solid balance between debt and equity.
- With a decent Current ratio value of 1.59, SU is doing good in the industry, outperforming 65.02% of the companies in the same industry.
Profitability Analysis for NYSE:SU
ChartMill assigns a Profitability Rating to every stock. This score ranges from 0 to 10 and evaluates the different profitability ratios and margins, both absolutely, but also relative to the industry peers. NYSE:SU scores a 6 out of 10:
- SU has a better Return On Assets (8.84%) than 71.92% of its industry peers.
- SU has a better Return On Equity (17.79%) than 68.97% of its industry peers.
- With a decent Return On Invested Capital value of 8.70%, SU is doing good in the industry, outperforming 60.10% of the companies in the same industry.
- SU's Profit Margin has improved in the last couple of years.
- SU has a Gross Margin of 61.96%. This is in the better half of the industry: SU outperforms 67.49% of its industry peers.
Our Best Dividend screener lists more Best Dividend stocks and is updated daily.
Check the latest full fundamental report of SU for a complete fundamental analysis.
Disclaimer
Important Note: The content of this article is not intended as trading advice. It is essential to perform your own analysis and exercise caution when making trading decisions. The article presents observations created by automated analysis but does not guarantee any trading or investment outcomes. Always trade responsibly and make independent judgments.
34.54
+0.73 (+2.16%)
Find more stocks in the Stock Screener
SU Latest News and Analysis
 5 days ago - ChartmillWhy the dividend investor may take a look at SUNCOR ENERGY INC (NYSE:SU).
Exploring SUNCOR ENERGY INC (NYSE:SU)'s dividend characteristics.
