Exploring NYSE:SU's dividend characteristics.
By Mill Chart
Last update: Oct 15, 2024
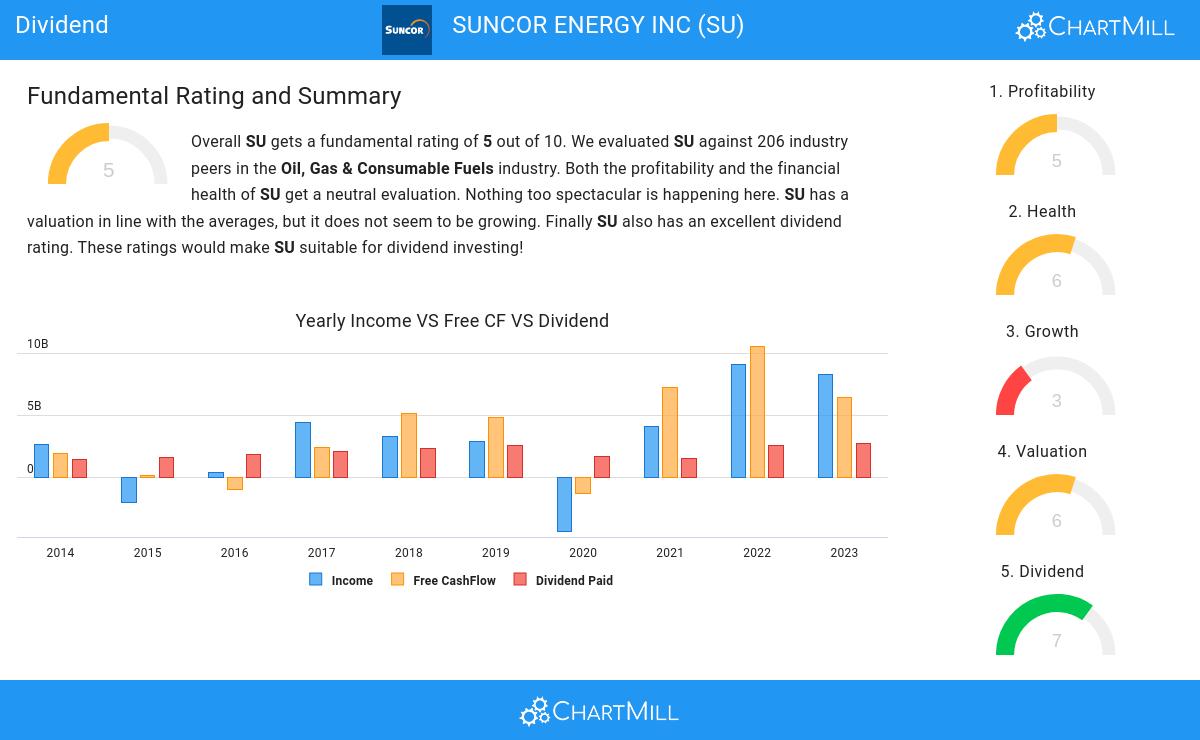
SUNCOR ENERGY INC (NYSE:SU) has caught the attention of dividend investors as a stock worth considering. NYSE:SU excels in profitability, solvency, and liquidity, all while providing a decent dividend. Let's delve into the details.
Exploring NYSE:SU's Dividend
An integral part of ChartMill's stock analysis is the Dividend Rating, which spans from 0 to 10. This rating evaluates diverse dividend factors, including yield, historical data, growth, and sustainability. NYSE:SU has received a 7 out of 10:
- Compared to an average industry Dividend Yield of 6.39, SU pays a bit more dividend than its industry peers.
- SU's Dividend Yield is rather good when compared to the S&P500 average which is at 2.22.
- On average, the dividend of SU grows each year by 7.66%, which is quite nice.
- SU has paid a dividend for at least 10 years, which is a reliable track record.
- SU pays out 36.86% of its income as dividend. This is a sustainable payout ratio.
- The dividend of SU is growing, but earnings are growing more, so the dividend growth is sustainable.
Exploring NYSE:SU's Health
ChartMill assigns a Health Rating to every stock. This score ranges from 0 to 10 and evaluates the different health aspects like liquidity and solvency, both absolutely, but also relative to the industry peers. NYSE:SU scores a 6 out of 10:
- The Debt to FCF ratio of SU is 1.80, which is an excellent value as it means it would take SU, only 1.80 years of fcf income to pay off all of its debts.
- The Debt to FCF ratio of SU (1.80) is better than 78.16% of its industry peers.
- A Debt/Equity ratio of 0.34 indicates that SU is not too dependend on debt financing.
- With a decent Current ratio value of 1.46, SU is doing good in the industry, outperforming 60.19% of the companies in the same industry.
A Closer Look at Profitability for NYSE:SU
ChartMill utilizes a Profitability Rating to assess stocks, scoring them on a scale of 0 to 10. This rating takes into account a variety of profitability ratios and margins, both in absolute terms and in comparison to industry peers. NYSE:SU has earned a 5 out of 10:
- The Return On Assets of SU (8.34%) is better than 68.45% of its industry peers.
- Looking at the Return On Equity, with a value of 16.95%, SU is in the better half of the industry, outperforming 62.62% of the companies in the same industry.
- SU's Profit Margin has improved in the last couple of years.
- Looking at the Gross Margin, with a value of 61.98%, SU is in the better half of the industry, outperforming 67.96% of the companies in the same industry.
Our Best Dividend screener lists more Best Dividend stocks and is updated daily.
Our latest full fundamental report of SU contains the most current fundamental analsysis.
Disclaimer
This article should in no way be interpreted as advice. The article is based on the observed metrics at the time of writing, but you should always make your own analysis and trade or invest at your own responsibility.
NYSE:SU (4/24/2025, 2:11:06 PM)
35.53
+0.45 (+1.28%)
Find more stocks in the Stock Screener
SU Latest News and Analysis
 12 days ago - ChartmillWhy the dividend investor may take a look at SUNCOR ENERGY INC (NYSE:SU).
Exploring SUNCOR ENERGY INC (NYSE:SU)'s dividend characteristics.
