Is NYSE:SU suited for dividend investing?
By Mill Chart
Last update: Sep 24, 2024
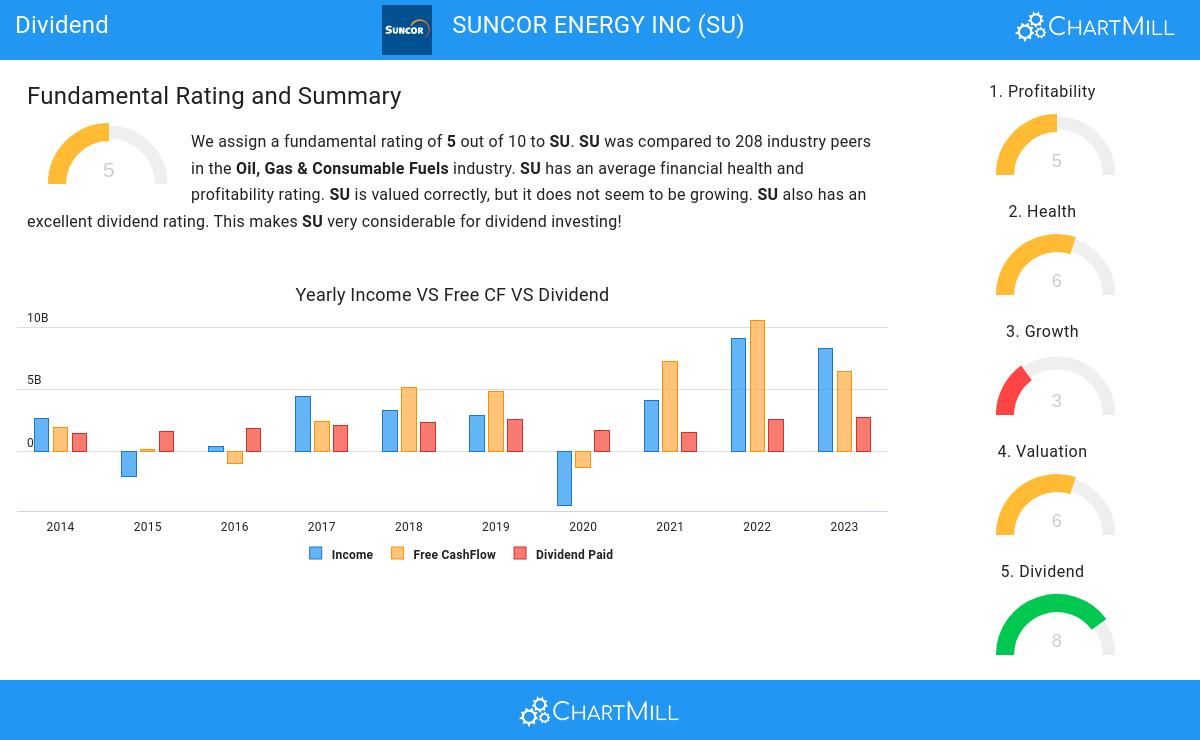
Unearth the potential of SUNCOR ENERGY INC (NYSE:SU) as a dividend stock recommended by our stock screening tool. NYSE:SU maintains a robust financial footing and delivers a sustainable dividend. We'll delve into the details below.
A Closer Look at Dividend for NYSE:SU
ChartMill assigns a proprietary Dividend Rating to each stock. The score is computed by evaluating various valuation aspects, like the yield, the history, the dividend growth and sustainability. NYSE:SU was assigned a score of 8 for dividend:
- With a Yearly Dividend Yield of 4.26%, SU is a good candidate for dividend investing.
- Compared to an average industry Dividend Yield of 6.09, SU pays a bit more dividend than its industry peers.
- Compared to an average S&P500 Dividend Yield of 2.21, SU pays a better dividend.
- On average, the dividend of SU grows each year by 7.66%, which is quite nice.
- SU has paid a dividend for at least 10 years, which is a reliable track record.
- SU pays out 36.86% of its income as dividend. This is a sustainable payout ratio.
- The dividend of SU is growing, but earnings are growing more, so the dividend growth is sustainable.
Health Assessment of NYSE:SU
ChartMill assigns a Health Rating to every stock. This score ranges from 0 to 10 and evaluates the different health aspects like liquidity and solvency, both absolutely, but also relative to the industry peers. NYSE:SU scores a 6 out of 10:
- SU has a Altman-Z score of 2.14. This is in the better half of the industry: SU outperforms 60.58% of its industry peers.
- SU has a debt to FCF ratio of 1.80. This is a very positive value and a sign of high solvency as it would only need 1.80 years to pay back of all of its debts.
- With a decent Debt to FCF ratio value of 1.80, SU is doing good in the industry, outperforming 78.85% of the companies in the same industry.
- A Debt/Equity ratio of 0.34 indicates that SU is not too dependend on debt financing.
What does the Profitability looks like for NYSE:SU
ChartMill assigns a proprietary Profitability Rating to each stock. The score is computed by evaluating various profitability ratios and margins and ranges from 0 to 10. NYSE:SU was assigned a score of 5 for profitability:
- SU's Return On Assets of 8.34% is fine compared to the rest of the industry. SU outperforms 68.75% of its industry peers.
- SU's Return On Equity of 16.95% is fine compared to the rest of the industry. SU outperforms 63.46% of its industry peers.
- In the last couple of years the Profit Margin of SU has grown nicely.
- The Gross Margin of SU (61.98%) is better than 68.27% of its industry peers.
More Best Dividend stocks can be found in our Best Dividend screener.
Our latest full fundamental report of SU contains the most current fundamental analsysis.
Keep in mind
This article should in no way be interpreted as advice. The article is based on the observed metrics at the time of writing, but you should always make your own analysis and trade or invest at your own responsibility.
35.6
+0.52 (+1.48%)
Find more stocks in the Stock Screener
SU Latest News and Analysis
 12 days ago - ChartmillWhy the dividend investor may take a look at SUNCOR ENERGY INC (NYSE:SU).
Exploring SUNCOR ENERGY INC (NYSE:SU)'s dividend characteristics.
